Methane Madness: How Pending LNG Export Projects Threaten the Planet, and How President Biden Can Stop Them
By Lukas Ross and Alan Zibel
Key Findings
● Eight proposed LNG export projects regulated by the US government are locking in long-term contracts with customers, a key step to attract investors and begin construction. But none of the eight projects have all the permits from the Biden Administration needed to proceed.
● If built, the eight pending projects will produce the annual equivalent of 113 coal plants in planet-warming emissions. President Biden could defuse these carbon bombs by pausing new Department of Energy approvals while existing regulations are overhauled.
● Undercutting industry claims that the expansion is needed for European energy security, more than half of the expected volume from these pending facilities will go to commodity trading firms and Big Oil’s speculative trading arms. That means the LNG from these facilities, if they are built, will be sold wherever these so-called “portfolio players” can turn the biggest profit. Four of the five largest purchasers by volume from pending facilities are speculators.
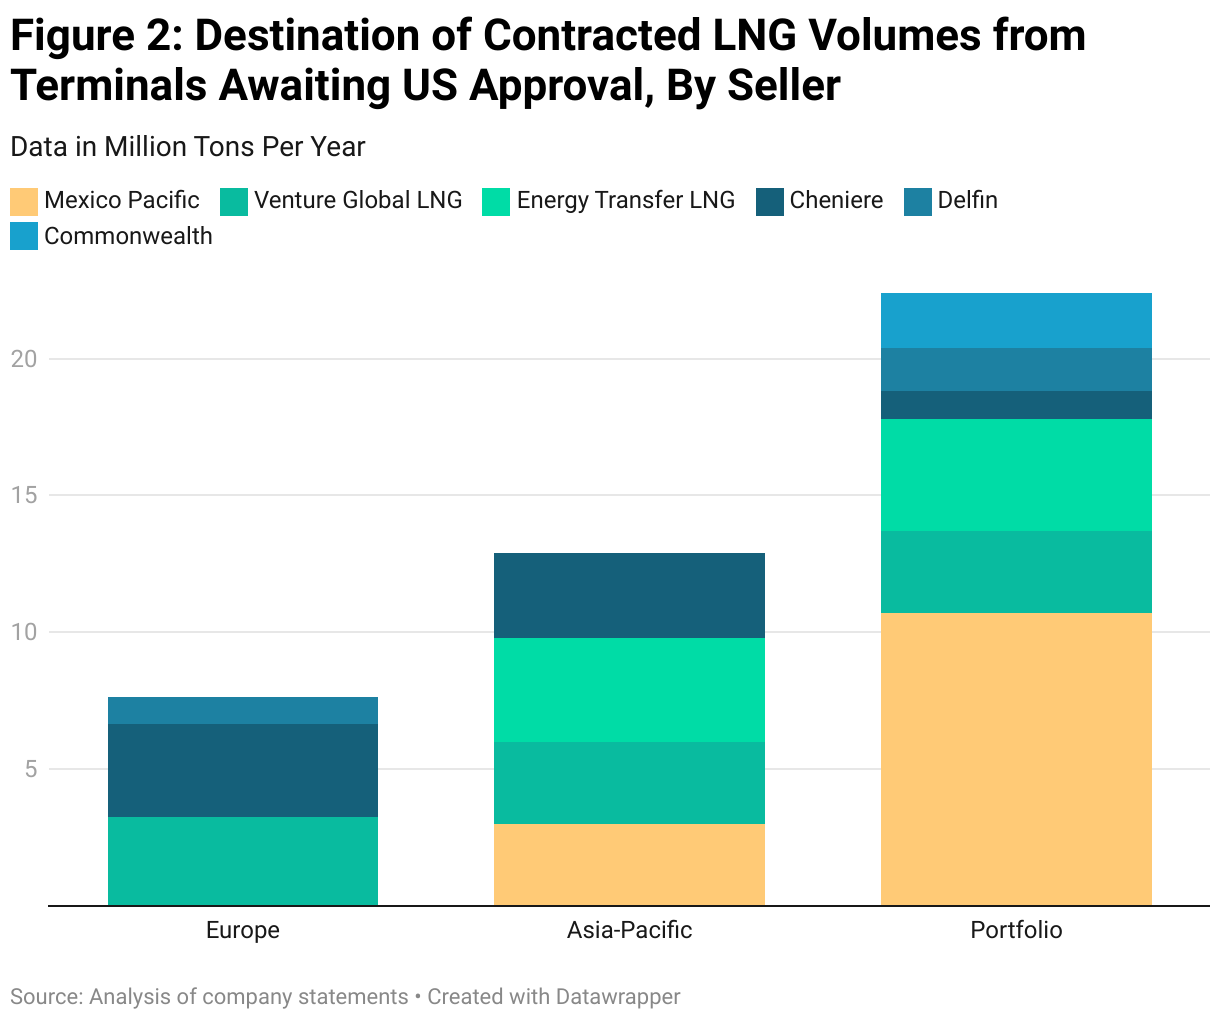
● The temporary surge in LNG exports to Europe since the outbreak of war in Ukraine is not translating into long-term demand. Contracts with European customers represent the smallest share (18%) from pending LNG facilities. Contracts with Asia Pacific customers account for 30% of total volume, with the remaining 52% going to commodity firms and other portfolio buyers. Nearly a quarter of the total pending contract volume is with companies headquartered in China.
Introduction
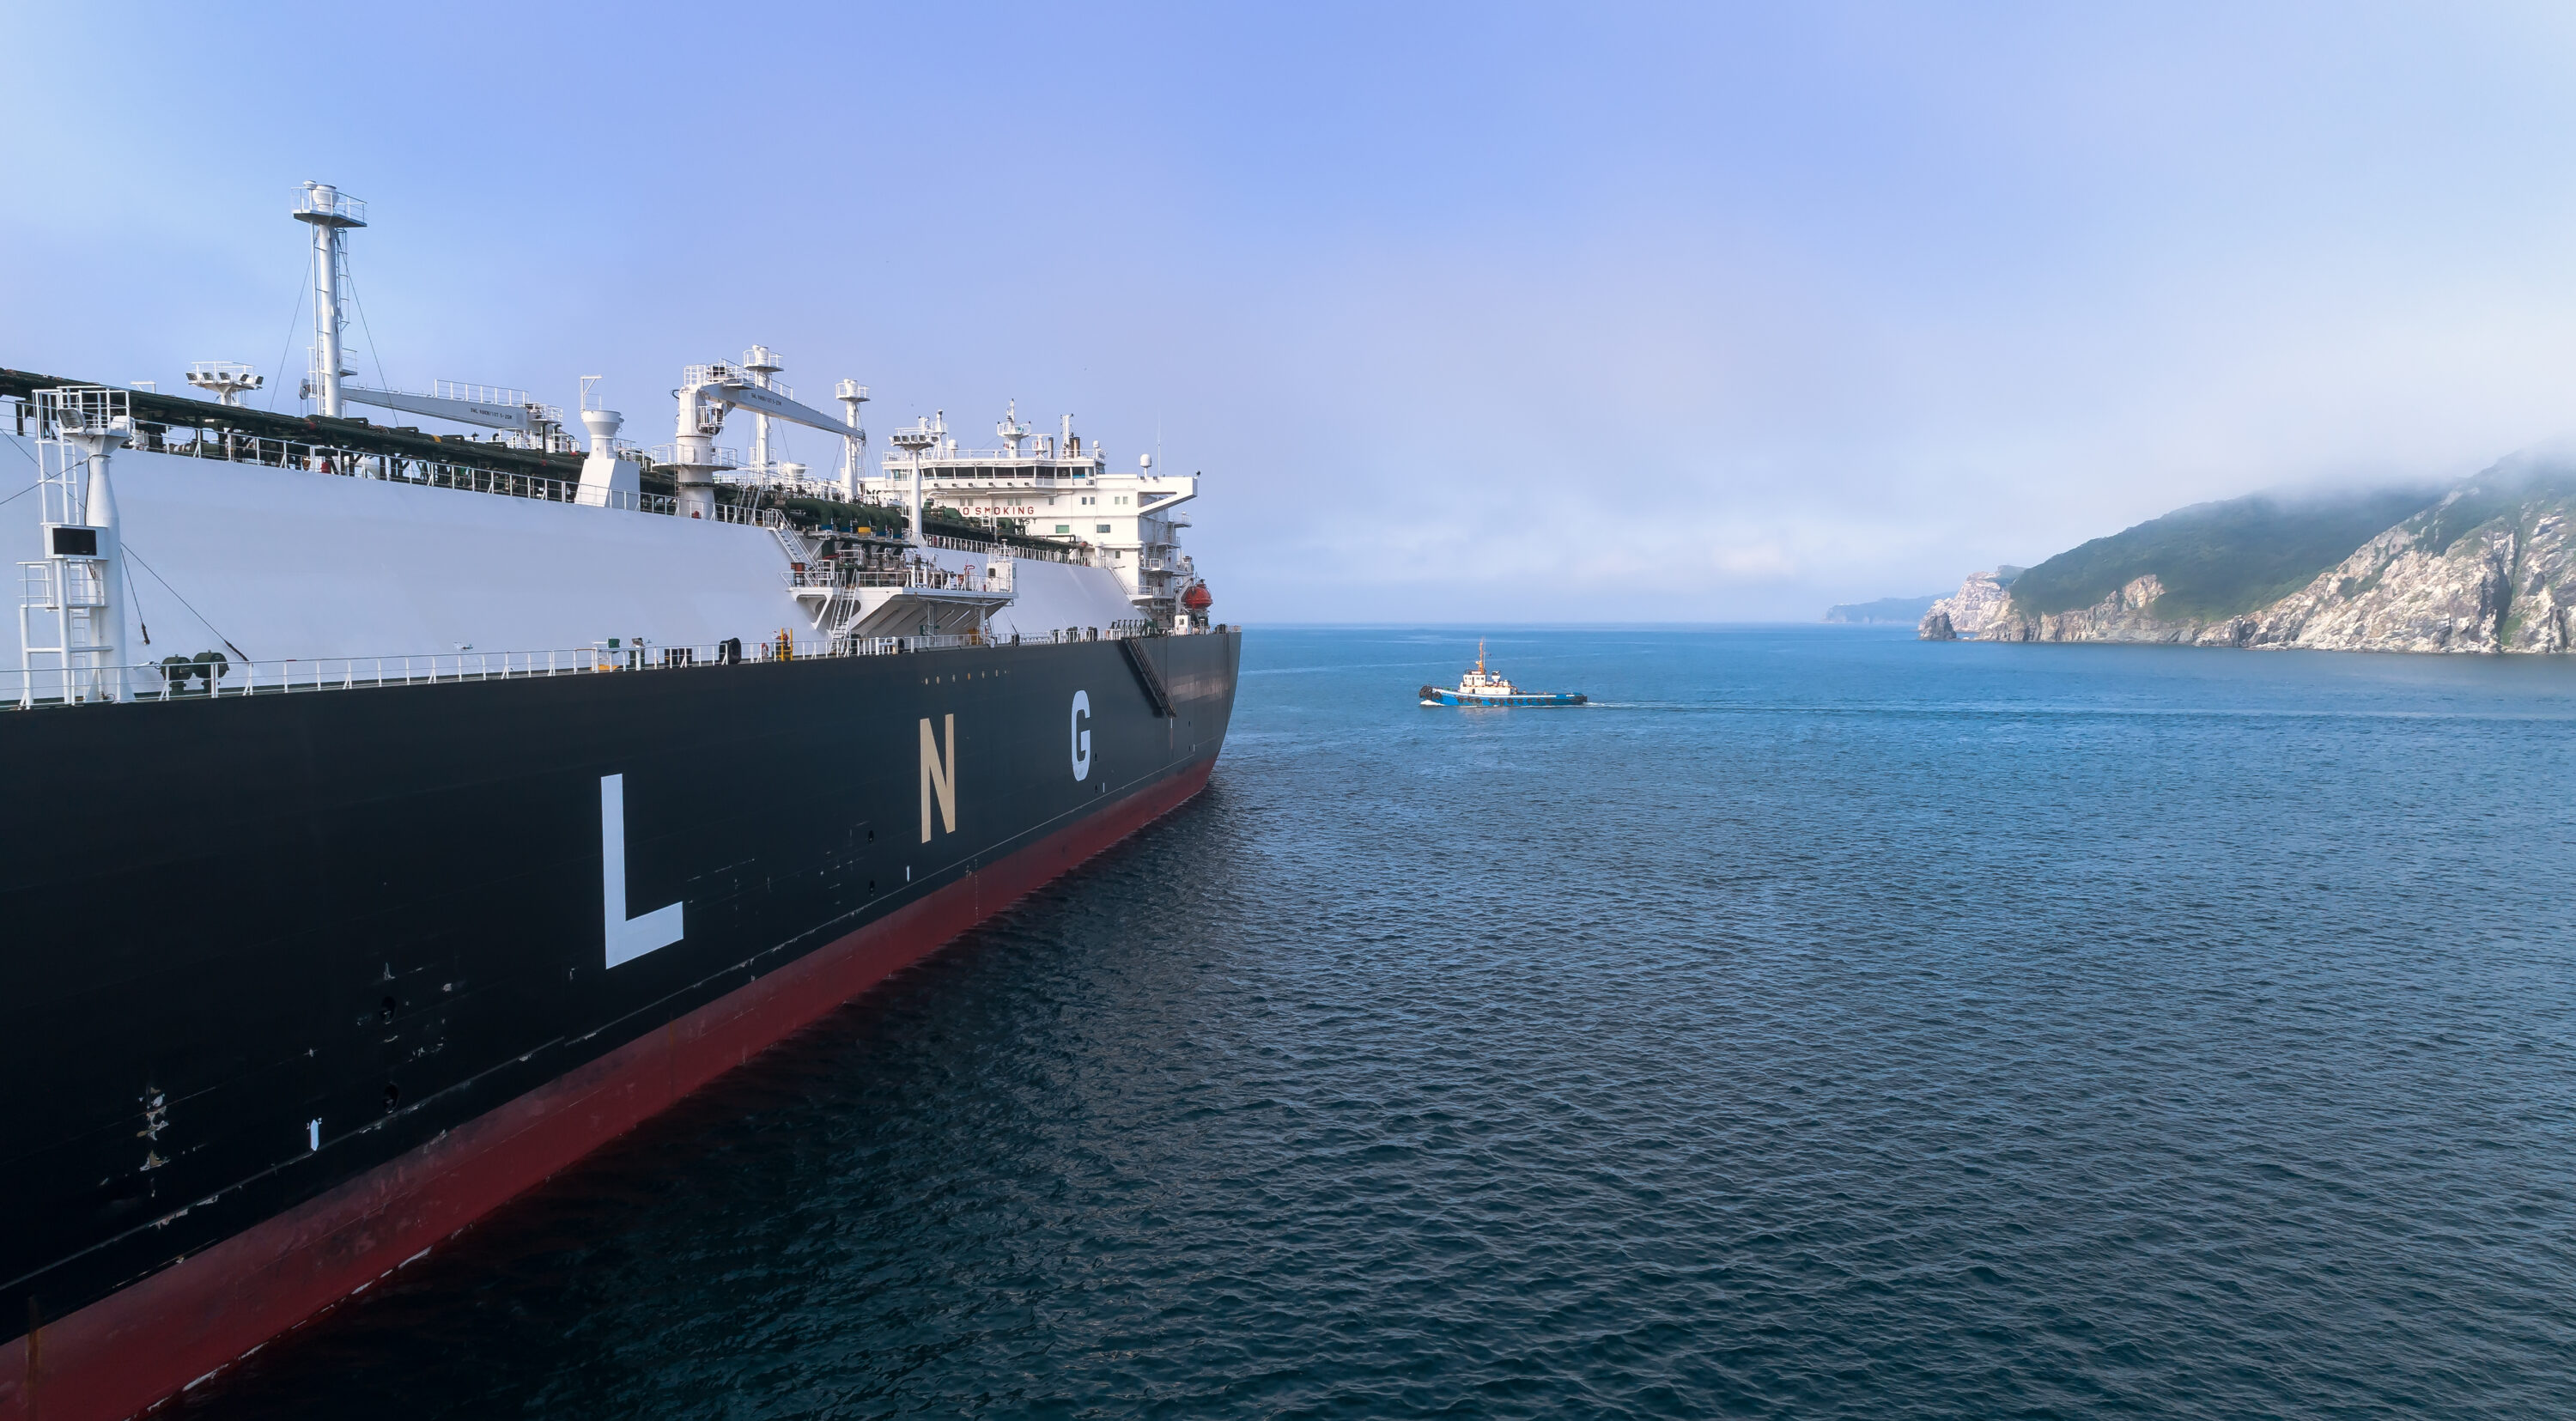
The United States is in the midst of a liquefied methane boom. In 2023, the US became the world’s top exporter of the fuel, which is used to heat homes and run power plants and often is abbreviated to LNG. By 2028, North American LNG exports are expected to more than double.
Fossil fuel corporations want to keep the fracked-gas party going. Eight more new LNG projects are quickly gaining commercial momentum, securing the long-term sales contracts needed to attract investors and commence construction. But they cannot proceed without final approval from President Biden’s Department of Energy (DOE), which must determine whether new export permits are in “the public interest” under the Natural Gas Act, passed in 1938.The same public interest test applies to facilities in Mexico or Canada if they are fed by US-produced methane, and need State Department approval for pipelines crossing the US border.
The White House is reportedly weighing reforms to the Department of Energy’s antiquated approach to the “public interest” test, currently a rubber stamp that survived largely unchanged through the Obama and Trump administrations. With the status quo locking in dangerous amounts of climate pollution and sticking everyday utility customers with higher energy bills, change is long overdue.
The American Petroleum Institute (API), meanwhile, is fighting to protect the LNG buildout with a new multi-million dollar ad blitz. The oil and gas lobbying group claims LNG “provides supply options for America’s allies — most notably to the European Union amid Russia’s aggression against Ukraine.” The facts contradict this national security narrative. Already-operating export terminals position the United States as the world’s top LNG supplier, providing more than enough methane for key allies. Further expansion of US LNG export capacity simply empowers API’s Big Oil members to increase profits while boosting prices paid by American families.
Friends of the Earth, Public Citizen, and BailoutWatch reviewed the more than 30 long-term supply contracts struck by LNG export projects still pending final approval. These contracts are essential for multi-billion dollar LNG terminal investments to proceed. These massive projects are being built by established major gas companies such as Cheniere Energy and Energy Transfer as well as startup companies such as Venture Global LNG and Mexico Pacific, which have received major investments from private equity firms and other investors.
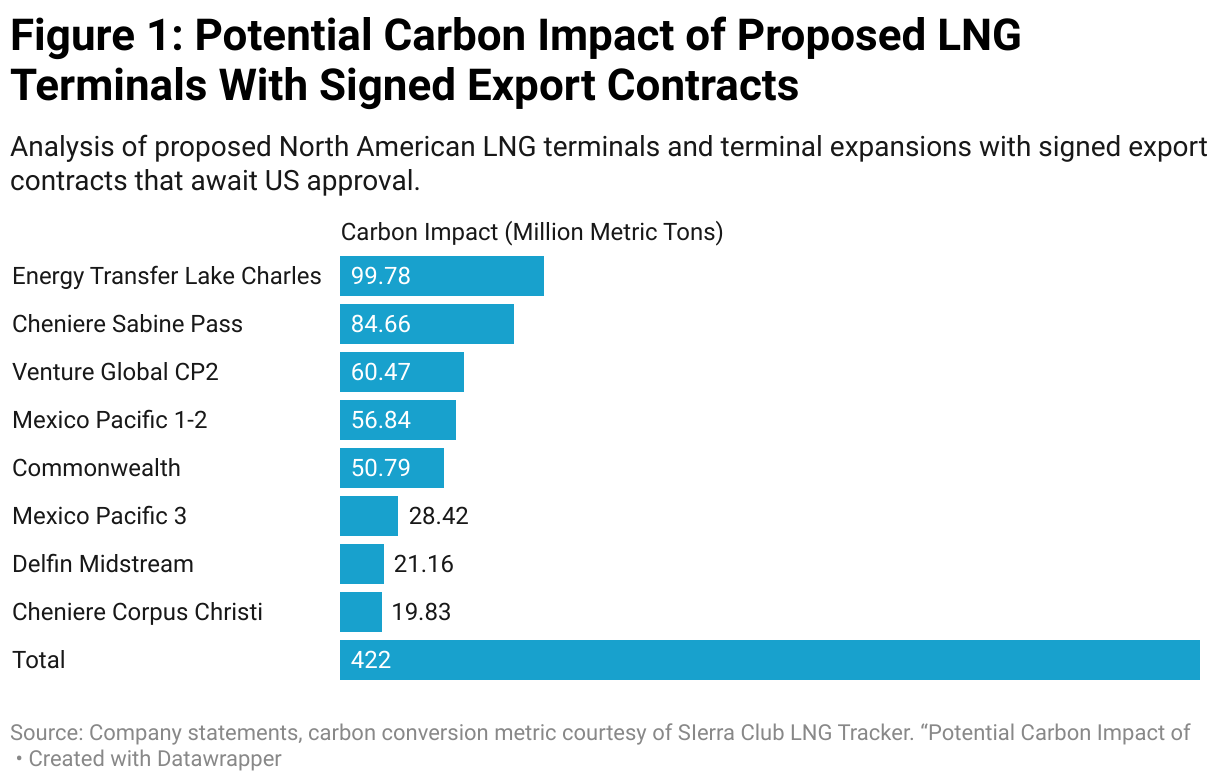
Table 1: LNG Export Terminals/Expansions Awaiting Approval With Signed Export Contracts
| Company | Facility | Location | Signed Contracts (mtpa) | Capacity (mtpa) | Carbon Impact (Million Metric Tons) | Status |
| Energy Transfer | Lake Charles | Lake Charles, Louisiana | 7.9 | 16.5 | 99.7755 | Pending DOE approval |
| Cheniere | Sabine Pass Expansion | Cameron Parish, Louisiana | 4.725 | 14 | 84.658 | Pending FERC |
| Venture Global | CP2, Phase 1 | Cameron Parish, Louisiana | 9.25 | 10 | 60.47 | Pending FERC |
| Mexico Pacific | Mexico Pacific 1 and 2 | Puerto Libertad, Sonora, Mexico | 9 | 9.4 | 56.8418 | DOE extension needed |
| Commonwealth | Commonwealth | Cameron Parish, Louisiana | 2 | 8.4 | 50.7948 | Pending DOE approval |
| Mexico Pacific | Mexico Pacific 3 | Puerto Libertad, Sonora, Mexico | 4.5 | 4.7 | 28.4209 | Pending DOE approval |
| Delfin Midstream | Delfin | Gulf of Mexico | 2.1 | 3.5 | 21.1645 | DOE extension needed |
| Cheniere | Corpus Christi Liquefaction 8 and 9 | Corpus Christi, Texas | 2.775 | 3.28 | 19.83416 | Pending FERC |
| Totals | 42.3 | 69.8 | 422.0 |
Source: Analysis of company statements. See Appendix for full methodology and list of existing contracts.
Global Boom is Costly for US Consumers and the Climate
The internationalization of the methane gas market is a relatively new phenomenon. The first major export shipment of US-produced LNG departed from Cheniere Energy’s Sabine Pass export terminal in Louisiana in 2016. With the advent of US shale gas production, energy companies launched a massive effort to build new export terminals and convert old import terminals to export terminals.
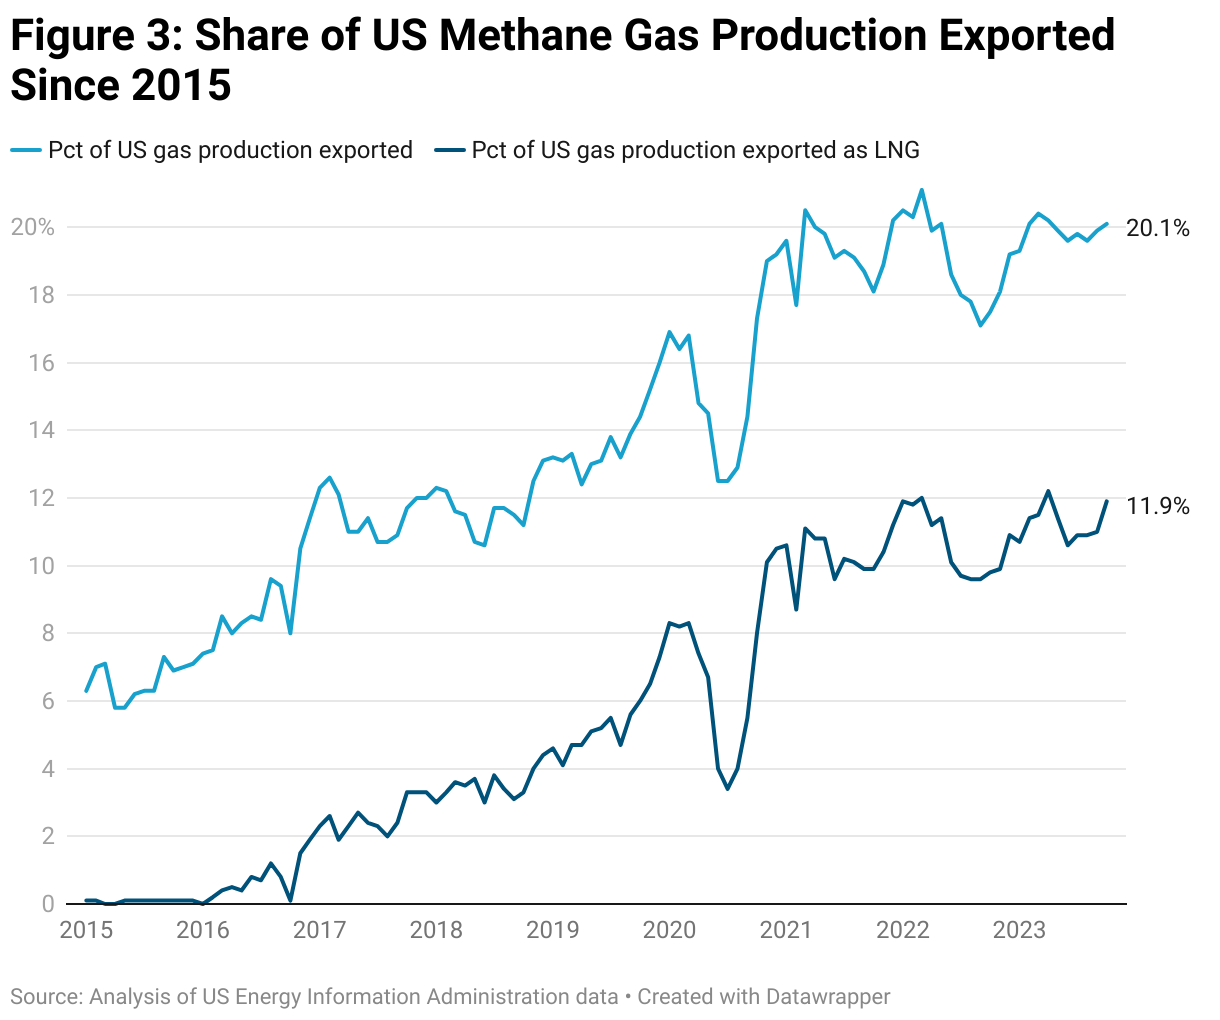
By 2023, the US had emerged as the world’s leading exporter, outstripping both Qatar and Australia. A full 20% of all methane gas produced in the US was exported–a majority of it as LNG, according to the Energy Information Administration.
Liquefying gas is an expensive and energy-intensive process. Methane normally exists in a gaseous state and evaporates quickly. To liquefy and ship it around the world, exporters must cool methane to negative 260 degrees Fahrenheit — then reheat it and transform it back into a gas for consumption at its destinations.
In flooding the world with exports, methane producers are thrashing American consumers with the effects of volatile global commodity markets through higher heating and electricity bills. As the Federal Energy Regulatory Commission (FERC) put it in a report, “…the expansion of LNG export capability has integrated formerly disparate North American regional natural gas markets into the global market.”
What that means, in short: Higher exports lead to higher prices. The main benchmark price for US fossil gas — based on the Henry Hub delivery depot in Cushing, Oklahoma — has always been significantly cheaper than other global benchmarks used in Europe and Asia. But the more US-produced LNG we export overseas, the more US consumers become competitors in a higher-priced global market.
The climate is another victim of this LNG export boom. Export terminals are multi-billion dollar, multi-decade investments. Each project locks in generations of emissions and extraction. From methane leakage — at fracking wells, pipelines, during liquefaction and shipment by tanker — to regasification and finally combustion, LNG is dirty at every stage of the supply chain.
A recent study from Cornell University’s Robert Howarth found that even under the most favorable shipping circumstances, LNG is still 18% worse for the climate than coal. Another study puts the total lifecycle emissions footprint of existing and under-construction LNG terminals in the US at 1,621 metric tons of CO2 equivalent per year, equivalent to the annual emissions of more than 475 coal plants.
Despite this contradictory evidence, the fossil fuel industry erroneously wants to rebrand LNG as a clean “bridge fuel” between coal and renewables. The argument fails because with renewable energy dropping in price, the logical comparison is between LNG and renewables. Indeed, one of the biggest failures of the DOE’s current “public interest” review process is the default assumption that LNG only displaces coal, never renewables (see below).
A European Sleight-of-Hand
The Russian invasion of Ukraine dealt a seismic shock to global energy markets. When pipelines to the European Union were cut off, methane gas prices soared to record levels. Methane deliveries tied to a key European benchmark rose to $68/mmbtu in August 2022 — more than seven times the price for methane pegged to Henry Hub.
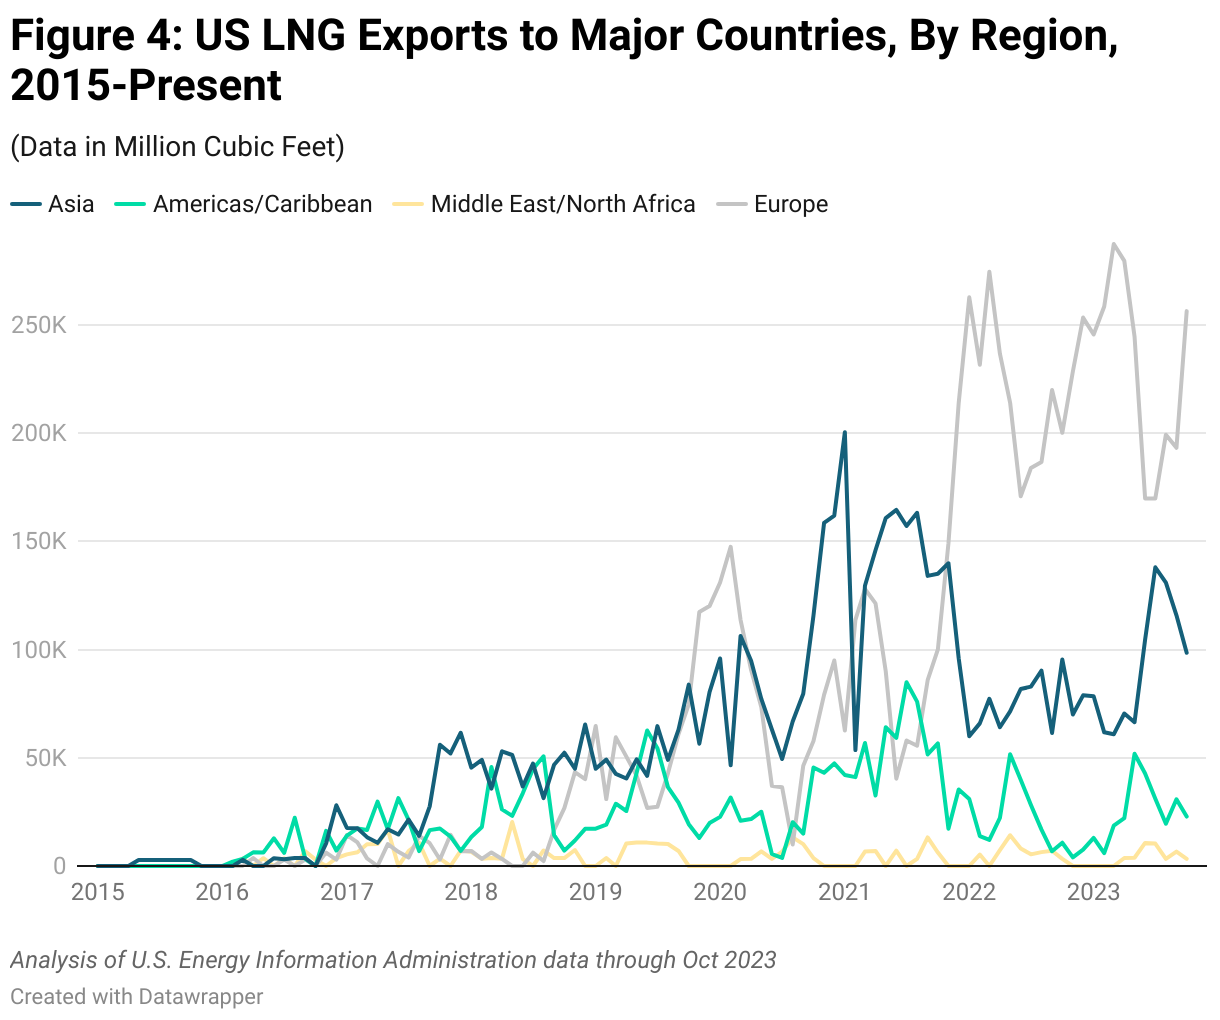
As prices there spiked, industry players diverted LNG cargoes from the Asia-Pacific region to Europe. Japan and South Korea have historically been the top two recipients of US LNG cargoes. The Russian invasion shifted the price preference to Europe, albeit temporarily. By the end of 2022, nine months into the war, US LNG exports to Europe had increased 141% from 2021, while LNG exports to Asia sunk by 46%.
When the fossil fuel industry sought to exploit the crisis in Ukraine, the Biden Administration rightly ignored calls to expedite permitting for new LNG projects. A commitment by the US to increase LNG exports to Europe was easily met and exceeded without expanding existing capacity. New LNG terminals take at least three years to build. Long-term infrastructure is a poor solution to short-term supply needs.
In Europe’s second full winter since the Russian invasion, the supply crisis has abated. Prices have returned to pre-war levels and methane gas storage heading into the winter heating season is at a historic high. Thanks to a combination of demand management and renewable investment, demand for methane in Europe is expected to drop over 50% from 2019 levels in only six years.
Though there remains pressure in Europe to expand LNG import infrastructure, there is plenty of spare import capacity to handle existing demand. Faced with shrinking methane demand overall, European needs are not an excuse to expand global LNG shipment.
A Future Glut
The LNG market is headed for a global glut. According to the Institute for Energy Economics and Financial Analysis (IEEFA), global capacity coming online in 2025 and 2026 will more than double the total capacity already existing in the US. If facilities still pending approval do begin construction, they will feed into a global market where excess supply is already pushing prices down for overseas buyers.
Looking again at long-term contracts with pending facilities, European buyers represent the smallest destination of future volume (18%), followed by the Asia-Pacific region (30%). The largest prospective buyers (52%) are commodity portfolio companies. This includes Big Oil giants like ExxonMobil, Chevron, and Shell, as well as the so-called independent trading houses like Vitol, Trafigura, and Woodside. These companies will send future LNG cargoes to where they are most profitable. And as parties to LNG supply contracts lasting at least 15 years, these purchasers have every incentive to exploit sharp spikes in prices to earn huge profits while pushing up prices for consumers around the globe.
Cheniere, the largest LNG exporter in the US, appeared to celebrate the potential price-lowering effects of an LNG glut on a call with investors in November 2023. “The concentration of [new LNG construction]…taking place this year and next, along with the start of delayed projects in East and West Africa, should help make LNG more accessible to price-sensitive markets,” said Chief Commercial Officer Anatoly Feygin — meaning more customers for Cheniere.
This idea of “price sensitivity” also appeared in a January 2023 memo to clients from the brokerage firm Nirmal Bang, which predicted that “…as prices decline, LNG demand in Asia may revive — especially in sensitive markets like India.”
The CEO of Total, the largest oil company in France and one of the largest LNG traders, expressed this argument most unapologetically at the COP 28 climate conference in Dubai:
“We know that when we want to grow LNG [demand], we want to have enough supply in order to have a price more in the range of $8-10 per MMBtu because then it is acceptable for the Indian economy, the Thai economy, Bangladesh or Japan, even the Korean economy,” said Total CEO Patrick Pouyanne.
In other words, Big Oil and the global commodity traders are gambling that excess supply will create its own demand — and lock another generation into burning fossil fuels. This is the market that the Biden Administration will feed if it approves additional LNG terminals.
Regulating LNG
The Federal Energy Regulatory Commission regulates onshore US LNG terminals, while the The Department of Energy regulates the export of the commodity methane gas.
An independent commission, FERC is composed of a maximum of five presidential appointees subject to Senate confirmation, with the majority shifting depending on the party of the President. Although Democrats hold the majority, the panel holds a well-founded reputation as a bipartisan rubber stamp for dirty infrastructure. For merely suggesting that FERC begin considering the climate impacts of the export terminals and methane pipelines, former FERC Chairman Richard Glick saw his renomination killed in 2022 by Senator Joe Manchin.
FERC, the exclusive regulator of LNG facilities themselves, does not oversee floating offshore terminals and projects in Mexico and Canada fed with US methane. LNG exports from all of these sources, however, are subject to the same DOE test: Are those exports in “the public interest”?
If LNG is exported to a country with which the US has a free trade agreement, the export is assumed to be in the public interest by default. But the vast majority of exports — nearly 80% as of September 2023 — historically have gone to countries where no such agreement exists. Because exports to these “non-free trade countries” depend on a positive public interest determination, DOE is a critical gatekeeper for further expansion.
Unfortunately, the public interest determination process is in urgent need of reform. One supporting rationale — a 2018 macro-economic report from the Trump Administration — assumes a net benefit from LNG exports, based in part on the dubious rationale that rising consumer prices will be offset by the growing value of fossil fuel stocks held in retirement funds. This is cold comfort for Americans without stock portfolios paying higher utility bills.
The DOE’s record on climate evaluation is equally troubled. Although the agency claims to evaluate approvals on a “case by case” basis, it tends to assume the purported net benefits of LNG relative to coal without rigorously measuring methane leakage across the supply chain. This badly skews lifecycle emissions analysis. The comparison of LNG to other fossils, rather than renewables, fatally flaws the assessment.
In addition to FERC and DOE approval, a 1953 Executive Order requires FERC to obtain a favorable recommendation from the Department of State prior to authorizing the construction of cross-border gas export pipelines. But the Biden State Department has abdicated its responsibility to seriously evaluate climate impacts. Exporting LNG will benefit the climate by “reducing the venting and flaring, and thus the greenhouse gas emissions,” the State Department wrote in a December 2023 letter to Public Citizen, explaining its decision to approve Oneok’s Saguaro pipeline to export US fracked gas from the Permian basin to LNG export terminals on the Pacific coast of Mexico.
This unsupported contention undermines crucial federal and state efforts to reduce harmful venting and flaring of methane from production wells. Rather than promoting more methane export infrastructure, the Biden administration should be working to cap oil and gas production and support stronger mandates to reduce venting and flaring. The oil and gas industry, opposing any federal or state efforts to limit venting and flaring, will likely cite the Biden State Department’s new policy of claiming increased methane exports will solve the wellhead pollution problem.
Unlike the ostensibly independent FERC, DOE and the State Department are Executive Branch agencies directly answerable to the president. Overhauling their approval process is the easiest route to centering the climate, consumer interests, and environmental justice in future LNG decisions.
Policy Recommendations
President Biden must act quickly to rein in the runaway LNG boom. He should:
- Pause DOE review of pending public interest applications for all new and expanded LNG projects.
- Overhaul the DOE public interest permitting process to incorporate lifecycle emissions, environmental justice, and consumer impacts — including an analysis of the impact on frontline communities and families at different income levels. Such a distributional analysis is required per the Biden Administration’s November 2023 final guidance to improve regulatory analysis, which requires agencies to determine how regulations impact families of different incomes.
- Establish proactive standards to curtail exports in the event of emergencies and seasonal demand surges.
- Revamp US Department of State procedures for reviewing exports’ impact on the climate.
- Nominate climate and consumer champions to the current Democratic FERC vacancy.
Methodology
The eight facilities we consider as pending in our dataset were chosen because they have shown commercial momentum in the form of signed long-term export contracts but still require some action from the Federal Energy Regulatory Commission, Department of Energy or both federal agencies.
Six of these terminals are on the Gulf of Mexico in Texas and Louisiana, and two are in the Gulf of California on the Pacific coast of Mexico. The facilities are: Venture Global’s CP2 Phase One; Cheniere Energy’s expansion of its existing Sabine Pass terminal; Cheniere’s expansion of its existing terminal in Corpus Christi, Texas; Commonwealth Energy’s proposed terminal in Cameron Parish, Louisiana; Energy Transfer’s proposed terminal in Lake Charles Louisiana; and Delfin Midstream’s proposed offshore terminal in the Gulf of Mexico. Because the developer of Mexico Pacific LNG in Sonora, Mexico intends to develop the project in two stages (Mexico Pacific 1 and 2 and Mexico Pacific 3) we treat those projects as distinct.
In calculating greenhouse gas emissions, the potential lifecycle emissions impact of these facilities was calculated using the same methodology as the Sierra Club LNG Tracker. The equivalency to annual coal plant emissions comes from the EPA Greenhouse Gas Emission Calculator.
In determining the likely destination of future LNG cargoes, we placed all contracts with commodity trading houses and Big Oil companies with commodity trading arms in the “Portfolio” category. For utility, industrial, and state-owned purchasers, we assumed the region of the purchaser to be the destination.
All LNG contracts cited directly reference either press releases from the companies themselves or filings from the companies with the DOE. In situations where data in press releases was contradicted by official filings with the DOE, we deferred to the DOE. Although Mexico Pacific 1 and 2 and Mexico Pacific 3 are being developed as two separate projects, there is insufficient data in the public record to tie contracts to individual trains. In Chart 1, we assumed that the total volume of existing contracts is divided equally between the three trains.
All of the LNG contracts from pending facilities are listed below:
Appendix: Signed Sale and Purchase Agreements (SPAs) for LNG Export Terminals Pending US Approval
| Buyer | Destination | Seller | Origin Facility | Volume (million tonnes per annum) | Years | Announcement Date | Announcement Quarter/Year |
| NFE North Energy | Portfolio | Venture Global LNG | CP2, Phase 1 | 1 | 20 | 16-March-2022 | 2022Q1 |
| ENN NG | Asia-Pacific | Energy Transfer LNG | Lake Charles LNG | 1.8 | 20 | 29-March-2022 | 2022Q1 |
| ENN Energy | Asia-Pacific | Energy Transfer LNG | Lake Charles LNG | 0.9 | 20 | 29-March-2022 | 2022Q1 |
| Guanzhou Energy | Asia-Pacific | Mexico Pacific | Mexico Pacific 1-3 | 2 | 20 | 31-March-2022 | 2022Q2 |
| Gunvor | Portfolio | Energy Transfer LNG | Lake Charles LNG | 2 | 20 | 2-May-2022 | 2022Q2 |
| SK Gas Trading | Asia-Pacific | Energy Transfer LNG | Lake Charles LNG | 0.4 | 18 | 3-May-2022 | 2022Q2 |
| ExxonMobil LNG Asia Pacific | Portfolio | Venture Global LNG | CP2, Phase 1 | 1 | 20 | 10-May-2022 | 2022Q2 |
| China Gas | Asia-Pacific | Energy Transfer LNG | Lake Charles LNG | 0.7 | 25 | 5-June-2022 | 2022Q2 |
| EnBW | Europe | Venture Global LNG | CP2, Phase 1 | 0.75 | 20 | 21-June-2022 | 2022Q2 |
| Equinor | Europe | Cheniere | Corpus Christi 8 and 9 | 0.875 | 15 | 9-June-2022 | 2022Q2 |
| Shell Eastern Trading | Portfolio | Mexico Pacific | Mexico Pacific 1-3 | 2 | 20 | 17-June-2022 | 2022Q2 |
| Chevron | Portfolio | Venture Global LNG | CP2, Phase 1 | 1 | 20 | 22-June-2022 | 2022Q2 |
| Chevron | Portfolio | Cheniere | Corpus Christi 8 and 9 | 1 | 15 | 22-June-2022 | 2022Q2 |
| Vitol | Portfolio | Delfin | Delfin | 0.5 | 15 | 13-July-2022 | 2022Q3 |
| PetroChina | Asia-Pacific | Cheniere | Corpus Christi 8 and 9 | 0.9 | 22 | 20-July-2022 | 2022Q3 |
| Shell | Portfolio | Energy Transfer LNG | Lake Charles LNG | 2.1 | 20 | 24-August-2022 | 2022Q3 |
| Woodside Trading | Portfolio | Commonwealth | Commonwealth | 2 | 20 | 5-September-2022 | 2022Q3 |
| EnBW | Europe | Venture Global LNG | CP2, Phase 1 | 0.25 | 20 | 6-October-2022 | 2022Q4 |
| Inpex | Asia-Pacific | Venture Global LNG | CP2, Phase 1 | 1 | 20 | 26-December-2022 | 2022Q4 |
| China Gas | Asia-Pacific | Venture Global LNG | CP2, Phase 1 | 1 | 20 | 23-February-2023 | 2023Q1 |
| ExxonMobil LNG Asia Pacific | Portfolio | Mexico Pacific | Mexico Pacific 1-3 | 1 | 20 | 7-February-2023 | 2023Q1 |
| ExxonMobil LNG Asia Pacific | Portfolio | Mexico Pacific | Mexico Pacific 1-3 | 1 | 20 | 7-February-2023 | 2023Q1 |
| Shell Eastern Trading | Portfolio | Mexico Pacific | Mexico Pacific 1-3 | 1 | 20 | 27-March-2023 | 2023Q1 |
| Shell Eastern Trading | Portfolio | Mexico Pacific | Mexico Pacific 1-3 | 1 | 20 | 27-March-2023 | 2023Q1 |
| Hartree | Portfolio | Delfin | Delfin | 0.6 | 20 | 24-April-2023 | 2023Q2 |
| JERA | Asia-Pacific | Venture Global LNG | CP2, Phase 1 | 1 | 20 | 28-April-2023 | 2023Q2 |
| Korea Southern Power (KOPSO) | Asia-Pacific | Cheniere | Sabine Pass Liquefaction Expansion | 0.4 | 18 | 16-May-2023 | 2023Q2 |
| Zhenjiang Energy | Asia-Pacific | Mexico Pacific | Mexico Pacific 1-3 | 1 | 20 | 31-May-2023 | 2023Q2 |
| SEFE Securing Energy for Europe GmbH (SEFE) | Europe | Venture Global LNG | CP2, Phase 1 | 2.25 | 20 | 22-June-2023 | 2023Q2 |
| Equinor | Europe | Cheniere | Sabine Pass Liquefaction Expansion | 0.875 | 17 | 21-June-2023 | 2023Q2 |
| ENN LNG (Singapore) | Asia-Pacific | Cheniere | Sabine Pass Liquefaction Expansion | 0.9 | 24 | 26-June 2023 | 2023Q2 |
| ConocoPhillips | Portfolio | Mexico Pacific | Mexico Pacific 1-3 | 1.7 | 20 | 30-June-2023 | |
| ConocoPhillips | Portfolio | Mexico Pacific | Mexico Pacific 1-3 | 0.5 | 20 | 30-June-2023 | 2023Q3 |
| Centrica LNG | Europe | Delfin | Delfin | 1 | 15 | 11-July-2023 | 2023Q2 |
| BASF | Europe | Cheniere | Sabine Pass Liquefaction Expansion | 0.8 | 17 | 22-August-2023 | 2023Q3 |
| Foran Energy Group | Asia-Pacific | Cheniere | Sabine Pass Liquefaction Expansion | 0.9 | 20 | 2-November-2023 | 2023Q4 |
| Gunvor | Portfolio | Delfin | Delfin | 0.5 | 15 | 27-November 2023 | 2023Q4 |
| Woodside Trading | Portfolio | Mexico Pacific | Mexico Pacific 1-3 | 1.3 | 20 | 6-December 2023 | 2023Q4 |
| OMV | Europe | Cheniere | Sabine Pass Liquefaction Expansion | 0.85 | 15 | 29-November 2023 | 2023Q4 |
| ExxonMobil LNG Asia Pacific | Portfolio | Mexico Pacific | Mexico Pacific 1-3 | 1.2 | 20 | 16-January-2024 | 2024Q1 |