Ultra-Rich Fund Huge Surge in Midterm Spending
By Alan Zibel
Just days before the before the 2018 midterm election, 56 ultra-wealthy individuals have contributed at least $2 million each to Super PACs – political action groups that can take unlimited donations and make unlimited election expenditures, a Public Citizen analysis finds.
These contributions add up to nearly $481 million, more than double the level seen in the 2014 midterms., and represent 37 percent of Super PAC contributions this year. Of these contributions, $253 million, or 53 percent, benefits Republicans and $210 million, or 44 percent, benefits Democrats.
Table #1: Super PAC Contributors of at least $2M
| Election Year | Donors $2M+ | Total
Contributions Over $2M |
Benefiting
GOP |
Benefiting
GOP % |
Benefiting
Dems |
Benefiting
Dem % |
% Of All
Super PAC contributions |
| 2018
(to date) |
56 | $480,732,799 | $252,816,055 | 53% | $210,461,514 | 44% | 37% |
| 2016 | 77 | $731,052,631 | $363,620,226 | 50% | $365,887,964 | 50% | 41% |
| 2014 | 24 | $200,362,587 | $73,967,658 | 37% | $107,823,000 | 37% | 29% |
| 2012 | 29 | $255,650,727 | $199,002,642 | 78% | $56,108,085 | 22% | 31% |
Source: Public Citizen analysis of Center for Responsive Politics data
The analysis demonstrates the extraordinary influence of mega-donors on American politics in the wake of the U.S. Supreme Court’s 2010 Citizens United v. Federal Election Commission decision, which allowed unlimited contributions from corporations and wealthy individuals to influence elections.
According to the Center for Responsive Politics, outside spending on the 2018 race from Super PACs and other outside groups has now exceeded the billion-dollar threshold, shattering the previous record for a midterm race and tilting in favor of Democratic candidates for the first time since 2008. Until this year, the 2012 and 2016 presidential elections were the only races to exceed $1 billion in outside spending.
By far the largest Super PAC contributor is Republican casino billionaire Sheldon Adelson, who has donated $112 million to Super PACs in 2018 and more than $287 million since 2012. The top five Super PAC contributors have spent more than $700 million to influence elections since 2012 and represent 19 percent of the $1.3 billion in super PAC contributions so far in 2018, Public Citizen found.
To compile this analysis, Public Citizen analyzed data from the Center for Responsive Politics on outside spending donors since 2012. This tally likely understates the influence of unlimited, outside donors , as many outside groups structured as nonprofit organizations do not typically disclose their donors. The data is current as of Nov. 1.
Table #1: Super PACs and Outside Spending
| Election Year | All Super PAC Contributions | All Super PAC Spending | All Outside Spending |
| 2018 (to date) | $1,308,946,692 | $777,662,325 | $1,026,199,395 |
| 2016 | $1,790,569,447 | $1,060,490,102 | $1,405,139,503 |
| 2014 | $696,011,919 | $345,110,359 | $567,026,509 |
| 2012 | $828,980,572 | $609,936,792 | $1,039,335,041 |
Source: Center for Responsive Politics
Table #2: Five Largest Super PAC Contributors 2012-2018
| Contributor | Party 2018 2016 2014 2012
Benefit |
All Years | ||||
| Adelson,
Sheldon G. & Miriam O. |
Republicans | $112,250,000 | $77,900,000 | $5,524,236 | $91,780,000 | $287,454,236 |
| Steyer, Thomas | Democrats | $49,742,581 | $89,544,744 | $73,725,000 | $0 | $213,012,325 |
| Uihlein, Richard | Republicans | $36,925,000 | $19,128,500 | $4,635,000 | $0 | $60,688,500 |
| Bloomberg, Michael R. | Democrats | $36,123,660 | $23,705,124 | $28,379,929 | $10,054,235 | $98,262,948 |
| Simons, James H. & Marilyn H. | Democrats
|
$16,716,000 | $25,025,000 | $7,275,000 | $9,575,000 | $58,591,000 |
| Total Big 5 | $251,757,241 | $235,303,368 | $119,539,165 | $111,409,235 | $718,009,009 | |
| All Super PAC Contributions | $1,308,946,6 92 | $1,790,569,4 47 | $696,011,919 | $828,980,572 | $4,624,508,630 | |
| Big 5 Percent of
Super PAC Contributions |
19% | 13% | 17% | 13% | 16% | |
Source: Public Citizen analysis of Center for Responsive Politics data
Chart #1: Targets of Outside Spending By Party (Millions)
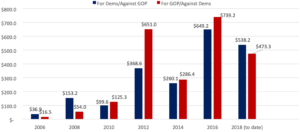
Source: Center for Responsive Politics, excludes party spending
So far outside spending groups have poured $963 million into the 2018 midterms, according to the Center for Responsive Politics. Of that money, the vast majority is is going to the most competitive House and Senate races, Public Citizen has found. Outside spending now exceeds candidates’ own spending, including some party spending, in 35 races, the highest number for a midterm election, according to the Center for Responsive Politics.
Table #3: Individual Super PAC Contributors Over $2M in 2018 and Prior Years
| Contributor | Party
Benefiting |
2018 | 2016 | 2014 | 2012 |
| Adelson, Sheldon G. & Miriam O. | Republican | $112,250,000 | $77,900,000 | $5,524,236 | $91,780,000 |
| Steyer, Thomas | Democrats | $49,742,581 | $89,544,744 | $73,725,000 | $0 |
| Uihlein, Richard | Republicans | $36,925,000 | $19,128,500 | $4,635,000 | $0 |
| Bloomberg, Michael R. | Largely
Democrats |
$36,123,660 | $23,705,124 | $28,379,929 | $10,054,235 |
| Simons, James H. & Marilyn H. | Democrats | $16,716,000 | $25,025,000 | $7,275,000 | $9,575,000 |
| Sussman, S. Donald | Democrats | $13,275,000 | $38,645,000 | $2,375,000 | $1,250,000 |
| Schwarzman, Stephen
A. |
Republicans | $11,750,000 | $4,858,290 | $0 | $0 |
| Griffin, Kenneth C. & Anne Dias | Republicans | $10,250,000 | $11,688,290 | $3,075,000 | $2,580,000 |
| Bezos, Jeff | Nonpartisan | $10,129,170 | $0 | $0 | $0 |
| Mellon, Timothy | Republicans | $10,010,000 | $0 | $0 | $0 |
| Eychaner, Fred | Democrats | $10,000,000 | $35,250,000 | $8,400,000 | $14,000,000 |
| Soros, George | Democrats | $9,505,886 | $20,239,693 | $3,285,000 | $2,775,000 |
| Hoffman, Reid Garrett | Democrats | $7,328,000 | $0 | $1,000,000 | $1,000,000 |
| Marcus, George M. | Democrats | $7,000,000 | $2,350,000 | $2,750,000 | $0 |
| Simon, Deborah | Democrats | $6,750,000 | $0 | $0 | $0 |
| Jurvetson, Karla | Democrats | $6,713,147 | $0 | $0 | $0 |
| Marcus, Bernard & Billi
Wilma |
Republicans | $6,479,600 | $11,458,200 | $580,500 | $0 |
| Yass, Jeffrey S | Republicans | $5,905,000 | $4,950,000 | $0 | $0 |
| Cameron, Ronnie | Republicans | $5,665,000 | $13,246,000 | $600,000 | $0 |
| Schwab, Charles R. & Helen O. | Republicans | $5,350,000 | $1,574,350 | $0 | $0 |
| Skjodt, Paul & Cynthia Simon-Skjodt | Democrats | $5,001,000 | $0 | $0 | $0 |
| Beal, D. Andrew | Republicans | $4,910,274 | $4,215,764 | $0 | $0 |
| Laufer, Henry B. & Marsha Z. | Democrats | $4,350,500 | $8,305,000 | $0 | $1,670,000 |
| Klarman, Seth A. & Beth S. | Democrats in
2018; Previously Republicans |
$4,250,000 | $2,922,073 | $2,950,000 | $0 |
| Palmer, Geoff | Republicans | $4,100,000 | $5,200,000 | $0 | $0 |
| Singer, Paul E. | Republicans | $4,038,438 | $24,095,153 | $10,522,824 | $2,815,316 |
| Mercer, Robert L. | Republicans | $3,927,100 | $22,551,000 | $9,070,000 | $5,409,354 |
| Bekenstein, Joshua | Democrats | $3,850,000 | $1,615,000 | $1,262,000 | $0 |
| Jacobs, Irwin M. & Joan K. | Democrats | $3,600,000 | $0 | $0 | $2,300,000 |
| Johnson, Charles B. | Republicans | $3,516,000 | $1,979,350 | $0 | $0 |
| Cohen, Steven A. | Republicans | $3,100,000 | $6,600,000 | $0 | $0 |
| Tierney, Daniel V. | Democrats | $3,019,999 | $0 | $0 | $0 |
| Hendricks, Diane Ms. | Republicans | $3,000,000 | $12,970,900 | $1,000,000 | $0 |
| Stephens, Warren A. & Harriet C. | Republicans | $2,850,000 | $11,842,613 | $2,685,000 | $0 |
| Wexner, Leslie H. | Nonpartisan | $2,800,000 | $2,191,450 | $0 | $0 |
| Abraham, S. Daniel & Ewa | Democrats | $2,750,000 | $0 | $0 | $1,700,000 |
| Goldman, Amy | Democrats | $2,600,000 | $3,725,000 | $1,999,759 | $3,400,000 |
| Moskovitz, Dustin & Tuna, Cari | Democrats | $2,594,250 | $19,915,000 | $0 | $0 |
| Heising, Mark W. & Elizabeth | Democrats | $2,500,000 | $2,501,000 | $1,400,000 | $0 |
| Humphreys, David C. | Republicans | $2,343,190 | $2,700,000 | $575,000 | $0 |
| Dunn, Tim | Republicans | $2,331,000 | $0 | $0 | $0 |
| Saban, Haim | Democrats | $2,275,000 | $13,780,000 | $0 | $0 |
| Sandler, Herbert M. | Democrats | $2,250,000 | $4,700,000 | $1,700,000 | $0 |
| MacFarlane, Seth W. | Democrats | $2,250,000 | $0 | $0 | $0 |
| Oberndorf, William E | Republicans | $2,200,000 | $4,511,656 | $758,680 | $0 |
| Rosenthal, Richard H. | Democrats | $2,125,000 | $2,155,000 | $0 | $0 |
| McNair, Robert | Republicans | $2,100,000 | $7,141,450 | $4,000,000 | $3,175,000 |
| Schwartz, Bernard L. | Democrats | $2,100,000 | $4,335,000 | $1,216,879 | $0 |
| Childs, John W. | Republicans | $2,082,553 | $2,838,345 | $2,415,000 | $4,225,000 |
| Soros, Alexander | Democrats | $2,036,127 | $4,500,000 | $0 | $0 |
| Moskowitz, Irving & Cherna | Republicans | $2,010,000 | $0 | $0 | $1,005,000 |
| Bezos, Miguel A. | Nonpartisan | $2,004,324 | $0 | $0 | $0 |
| Bergan, Mary A. | Republicans | $2,000,000 | $0 | $0 | $0 |
| Quillin, Patty | Democrats | $2,000,000 | $0 | $0 | $0 |
| Foster, Paul L. | Republicans | $2,000,000 | $2,000,000 | $1,005,000 | $0 |
| Scully, William P. | Republicans | $2,000,000 | $0 | $0 | $0 |
Source: Public Citizen analysis of Center for Responsive Politics data