Trump’s New Corporate Interest Healthcare Advisory Panel
Financial conflicts of interest are widespread among a new Trump Administration Healthcare Advisory Committee tasked with providing the Department of Health and Human Services and the Centers for Medicare and Medicaid advice on improving, strengthening and modernizing the U.S. healthcare system, a Public Citizen analysis found.
Nearly all the appointees hold senior leadership positions in health care organizations that are invested in making money off the U.S. health system, suggesting they may be more committed to serving the bottom lines of groups that profit from the U.S.’s broken health care framework than providing advice that will best serve the needs of American patients. Some are, or were in the past, involved in lobbying for health industry interests. None of the appointees are patient or consumer representatives.
Only a third of the committee (6/18) are medical doctors and two members are former nurses. Most of the medical professionals don’t appear to have much current involvement in direct patient care and instead serve in business and operational roles.
Many of the appointees to the new Healthcare Advisory Committee are politically connected to the Trump world or Republican party or have business relationships with the Trump family or Trump administration officials, indicating little diversity in political philosophy among the panel members and questions about the likelihood their appointments were in part a reward for political donations and favors, not their qualifications and expertise.
It is not clear whether this group meets the requirements for membership balance under the Federal Advisory Committee Act.
Despite spending the most per capita on health care, the U.S. consistently has lower life expectancy than our peers in comparably wealthy countries with universal health care. Profit-driven health care is not the way forward, but our overview of the panel’s backgrounds reveals they are likely to recommend more of the same failing strategies. They appear largely invested in health care as a money-making business, not a human right.
Highlights of Committee Members:
- Robert Bressler, MD is the CEO of Honest Medical Group, an organization whose stated aim to is to improve patient health outcomes and reduce costs. The company was started in 2021 by three investors at Rubicon Founders including Trumps’ now CMS Innovation Center Director Abe Sutton. Sutton previously served in Trump’s first administration with stints on the President’s National Economic Council, as an advisor to the Secretary of HHS and policy advisor at the Domestic Policy Council. Honest Medical Group was also co-founded by Adam Boehler, who is currently a Trump special advisor for hostage response and Trump’s former CMMI head during his first term. Bressler has donated to the GOP’s WinRed Political Action Committee.
- Kimberly Brandt, JD, (ex officio) is currently CMS’s deputy administrator and chief operating officer. She also served as a political official at CMS during the first Trump administration. She is currently under scrutiny from Democrats for her role in cutting off some of Minnesota’s Medicaid funding. Brandt has worked as a Republican staffer for the Senate Finance Committee and has a history of donating to Republican political candidates and groups. Brandt has also held work as a lobbyist including for many major drug companies like Amgen, AstraZeneca, Eli Lilly, Merck, Novartis, Sanofi and more, along with medical device companies, and the drug industry trade group the Biotechnology Innovation Organization.
- Sebastian Caliri, is a venture capitalist at 8VC. 8VC invests in a range of life science and health care companies such as Blink Health, a prescription drug platform whose board includes Trump’s son Donald Trump Jr. Caliri, previously served as the commercial lead for healthcare for Palantir Technologies, an organization that is now infamous for helping with Trump’s cruel anti-immigrant agenda leading some S. health systems to cut ties with the company.
- Stephanie Carlton, (ex officio) is the current CMS Chief of Staff and Deputy Administrator who previously worked on the S. Senate Finance Committee Republican staff as well as with other Republican members of Congress. She began her career as a labor and delivery nurse but has spent most of her career not providing patient care. She has donated to President Trump.
- David Carmouche, MD, is chief medical and commercial officer at Lumeris, a health tech firm that helps health systems manage value-based care requirements through the use of artificial intelligence and other software tools. He came to Lumeris from Walmart where he served as senior VP of healthcare delivery including work on a virtual care partnership with United Healthcare’s Optum. Prior to Walmart he was executive VP at Oschner Health, a nonprofit academic health system and chief medical officer and executive VP of external operations at Blue Cross and Blue Shield of Louisiana. He spent the first 15 years of his career as the medical director of the center for cardiovascular disease prevention, as an internal medicine doctor. He has a history of donating to Republicans including
- Elizabeth M. Fago, who worked in the nursing home business, has raised millions of dollars for President Trump. In 2025, Trump pardoned her son Paul Walczak, a former nursing home executive, who pleaded guilty to tax crimes, including using money withheld from employee paychecks that was supposed to go toward Social Security, Medicare and federal income tax, for personal purposes. Walczak took over the nursing home business from his mother.
- Clive K. Fields, MD was the cofounder of VillageMd, a health care provider business focused on primary care. He has donated to many Republican office holders and PACs.
- William J. Gassen, JD is the president and CEO of Sanford Health an $11 billion non-profit health system largely serving people in the upper Midwest. He is also the chair-elect of the American Hospital Association, which lobbies for non-profit hospitals, and will be AHA’s chair in 2027. Gassen also is on the board of the health care lobbying group Coalition to Strengthen America’s healthcare which represents both for-profit and not for profit health organizations. He’s on the board of Oscar Health, a for-profit health insurance and health tech company, that was co-founded by the brother of Trump’s son-in-law Jared Kushner. Kushner is also an investor in Oscar. Gassen also serves on the board of the Greater Sioux Falls Chamber of Commerce and Medical Alley, a network of more than 800 health care industry organizations that includes drug and medical device companies and health insurance companies among other. Gassen has contributed to Republican candidates for elected office and PACs.
- Jenni Gudapati, PhD, is the president and co-founder of ai, a health tech company and the director for Boise State University’s Value-Based Healthcare program. She also founded and leads a health consulting company Amethyst Solutions. She began her career as a nurse. Gudapati said that Republican Sen. Mike Crapo supported her nomination to the advisory panel and she has publicly praised the Make America Healthy Again agenda.
- Valerie D. Huhn is the director for the Missouri Department of Mental Health. She has spent most of her career working for Missouri state government in health and human services agencies.
- Dennis Laraway is an executive VP and Chief Financial Officer at Cleveland Clinic. He has spent most of his career as a CFO for non-profit medical systems.
- Dan Liljenquist, JD is the chief strategy officer at Intermountain Health. He is also the chair of the board for Civica Rx, a nonprofit generic drug company and chairman of the board at Graphite Health, a nonprofit health software company. Between 2009 and 2011 he served as a Republican in the Utah State Senate. He also ran for U.S. Senate as a Republican. When in state office, he sponsored a Medicaid reform law that switched Utah’s Medicaid system to a managed care system, Liljequist has contributed to Republican politicians and PACs as well as the American Hospital Association PAC.
- Andrew Lynch, PhD, has been Chief Strategy Officer at Acadia Healthcare since 2022, a for-profit behavioral health company that has faced a number of legal challenges in recent years including scrutiny for understaffing of the psychiatric hospitals it operates. In 2024 Acadia settled with the Justice Department for $19.85 million over allegations it billed for medically unnecessary care. Lynch is also the board chair elect of the National Association for Behavioral Healthcare, which lobbies for behavioral healthcare providers. He has worked throughout the health system including for health insurance company Humana, and drug company Pfizer. He regularly contributes to Acadia’s PAC which historically gives the majority of its donations to Republicans.
- Ursel J. McElroy, is the director of Ohio’s Department of Aging, appointed by Republican Governor Mike DeWine in 2019. She has spent most of her career in local and state government.
- Kyu Rhee, MD is the CEO and president of the National Association of Community Health Centers, which lobbies on behalf of community health centers. He is also a medical advisory board member at Found Health a telehealth weight loss company, Prior to working at NACHC he was a senior vice president and Chief Medical Officer at Aetna, the insurance division of CVS Health. Before that he spent more than a decade as the chief health officer for IBM and served as chief public health officer of the Health Resources and Services Administration and as Director of the Office of Innovation and Program Coordination at NIH. He has served as advisor to many companies in the health space.
- Tony Robbins is a motivational speaker and life coach who profits from expensive and unproven supplements as well as digital and in person health and health-adjacent programs and a streaming TV network, among other ventures. Robbins reportedly was approached by Health Secretary Robert F. Kennedy Jr. to be Kennedy’s running mate for his 2024 Presidential bid.
- Russ Thomas, JD is the CEO of Availity, a health tech company that helps payers, providers and insurance companies exchange information.
- Linda Thomas-Hemak, MD is the president and CEO of the Wright Center for Graduate Medical Education, a non-profit that provides primary care and medical training. She has donated to both Democratic and Republican election campaigns.
You might be interested in
Stay Updated on Public Citizen
Follow Public Citizen
Support Our Work
Letter to the Utah Department of Commerce: Artificial Intelligence (AI) Prescription Renewal is Untested, Dangerous
View letter
View press release
Utah should suspend its AI-enabled prescription renewal systems pending further review of their legality, safety, accountability and compliance with existing standards governing the practice of medicine, Public Citizen said today in a letter to the Utah Department of Commerce. Furthermore, the department should exercise heightened vigilance before expanding the use of AI systems in clinical decision-making, particularly when AI tools can influence prescription renewals, diagnosis, treatment recommendations, triage, and other functions traditionally reserved for licensed medical professionals.
You might be interested in
Stay Updated on Public Citizen
Follow Public Citizen
Support Our Work
Public Citizen Calls for Suspension of Utah AI-Enabled Prescription Renewals
Zach Boyd, PhD
Director, Utah Office of Artificial Intelligence Policy
Utah Department of Commerce
Heber M. Wells Building
160 East 300 South
Salt Lake City, Utah 84111
Dear Dr. Boyd,
Public Citizen is a national nonprofit organization with more than 1 million members and supporters across the country. Since our founding in 1971, we have represented the public interest through legislative and administrative advocacy, litigation, research and public education on a broad range of issues including ensuring access to safe and effective healthcare.
Public Citizen writes in support of the letter issued by the Utah Medical Licensing Board on April 20, 2026, calling for the suspension of AI-enabled prescription renewal systems pending further review of their legality, safety, accountability and compliance with existing standards governing the practice of medicine.[1] Public Citizen further urges the Utah Office of AI Policy to exercise heightened vigilance regarding the expanding use of artificial intelligence (AI) systems in clinical decision-making, particularly when AI tools are being positioned to influence prescription renewals, diagnosis, treatment recommendations, triage or other functions traditionally reserved for licensed medical professionals.
Recent state experimentation with AI-enabled prescription renewal systems has accelerated a broader policy question that now confronts every medical board and AI oversight authority in the country: whether AI marketed as efficient clinical support is now moving beyond assistance and into the unauthorized practice of medicine. Some pilot efforts have been described as narrow or carefully supervised, but even limited deployments reveal how quickly temporary oversight mechanisms can evolve into autonomous decision-making with diminished physician involvement. As recent medical scholarship has noted, several pilot designs begin with only physician review for an initial subset of cases before transitioning toward independent AI action, creating a pathway in which human review becomes episodic rather than continuous.[2]
Prescription renewal is not an administrative exercise that can safely be treated as low risk for automation. Prescription renewals often require individualized judgment regarding whether a patient’s clinical condition has changed, laboratory work is overdue, adverse side effects have emerged, interactions with newly added medications exist or continued prescribing remains medically appropriate under evolving circumstances. Scholars reviewing Utah’s prescription-renewal pilot have emphasized that meaningful therapeutic monitoring, dose adjustment and clinical reassessment remain core medical functions better suited to licensed professionals than to software systems operating under generalized assumptions.[3]
Public Citizen is particularly concerned that continued deployment of these systems, while unresolved legal and clinical concerns remain, could normalize AI systems performing core medical functions before adequate safeguards, accountability structures and independent evidence are in place. Suspension is therefore an appropriate and necessary precautionary measure while regulators, medical boards and policymakers determine whether such systems can lawfully and safely operate within existing medical practice frameworks.
Experience across sectors demonstrates that when AI generates a recommendation, professionals often face institutional pressure to approve outputs quickly, particularly in high-volume settings.[4] In healthcare environments, this creates a serious risk that nominal physician supervision becomes little more than rubber-stamp approval of machine-generated conclusions. Systems advertised as “physician supervised” may, in practice, normalize deference to algorithmic outputs where speed, workflow efficiency and labor reduction are prioritized by administrators. Research has further demonstrated that excessive reliance on AI systems can contribute to skill degradation and automation bias among medical professionals.[5]
There is also little independent evidence supporting the safety and efficacy of these systems under real-world prescribing conditions. In several recent cases, publicly cited validation has relied on simulation studies, company-authored preprints or internal comparisons conducted in settings materially different from the environments in which these tools are now being deployed. Independent clinical evidence demonstrating safety in chronic medication-renewal contexts remains limited.[6]
Medical boards and AI regulators should also consider the downstream consequences for accountability and patient protection. When an AI-generated clinical decision causes harm, patients may struggle to determine who bears responsibility. Emerging scholarship has raised concerns that some AI vendors reserve broad contractual protections for themselves while patients face substantial barriers to obtaining records sufficient to understand what occurred or who may be legally accountable.[7] Without reliable audit trails, preserved decision logs and clear documentation of how outputs were generated, disciplinary review and patient protection become substantially impaired.
Equally concerning is the growing use of marketing language that equates AI software with licensed medical practice. Terms such as “AI doctor,” “medical-grade AI” or similar descriptors risk misleading patients into believing they are receiving care from an entity possessing legal licensure, professional judgment and fiduciary obligations equivalent to those of a physician. No software application holds a medical license. No AI system assumes professional ethical duties. No algorithmic model can independently satisfy the obligations imposed upon licensed medical professionals. This creates a dangerous discrepancy in which licensed clinicians remain subject to professional liability while AI health companies seek to avoid equivalent accountability.
Accordingly, Public Citizen urges the Utah Office of AI Policy to support and reinforce the Utah Medical Licensing Board’s call for suspension pending further review and to adopt the following principles when evaluating AI deployment in clinical settings:
- AI must not independently perform acts that constitute the practice of medicine absent clear physician accountability. Prescription initiation, renewal, modification, diagnosis and treatment recommendations should remain attributable to a licensed clinician who meaningfully reviews patient-specific circumstances.
- Physician oversight must be substantive, not symbolic. Boards should require documentation demonstrating when clinicians intervene, override or reject AI outputs rather than assuming oversight exists because a physician is nominally connected to a system.
- Patients must receive clear disclosure when AI is involved in any clinical recommendation. Disclosure should explain that AI is a software tool, identify the extent of physician review and avoid marketing language implying professional licensure.
- Medical boards should require preserved records sufficient for investigation. Any AI-assisted clinical interaction should generate accessible documentation showing what information the system relied upon, what recommendation it produced and how a clinician responded.
- Boards should coordinate with federal regulators where device oversight may be implicated. Several legal scholars have argued that autonomous prescribing systems likely fall within the category of medical devices requiring federal scrutiny, particularly when software is performing treatment functions rather than merely supporting clinician judgment.[8]
While medical professional shortages and healthcare system strain are serious concerns, pressure to improve efficiency cannot justify weakening foundational safeguards governing patient safety, long-term disease management, informed medical judgment and clinical accountability. State medical boards exist precisely because medical expertise, clinical oversight and professional accountability require specialized knowledge developed through licensure, training and ongoing regulatory supervision. The Utah Office of AI Policy possesses expertise in technology policy, but it is not a medical licensing authority and should defer to the professional judgment of the Utah Medical Licensing Board on questions involving the practice of medicine and patient safety.
We cannot permit a regulatory framework in which generalized AI expertise is treated as sufficient to supersede the judgment of trained professionals and expert oversight bodies within their respective fields. Allowing technology officials or AI developers to override medical boards on matters of clinical practice risks eroding longstanding safeguards designed to protect patients from unsafe or insufficiently tested interventions. That responsibility is especially important now before autonomous clinical systems become normalized through premature deployment and experimentation.
Public Citizen therefore urges the Utah Office of AI Policy to support the Utah Medical Licensing Board’s request for suspension and to ensure that AI systems do not displace the professional obligations, judgment and accountability that licensed medical practice requires.
Sincerely,
Robert Steinbrook, M.D.
Director
Public Citizen’s Health Research Group
J.B. Branch
AI Governance and Technology Policy Counsel
Public Citizen’s Congress Watch division
Eagan Kemp
Health Care Policy Advocate
Public Citizen’s Congress Watch division
CC:
Utah Governor Spencer Cox
Sen. Mike Lee
Sen. John Curtis
Rep. Blake Moore
Rep. Celeste Maloy
Rep. Mike Kennedy
Rep. Burgess Owens
Utah Senate President J. Stuart Adams
Utah Senate Minority Leader Luz Escamilla
Utah Speaker Mike Schultz
Utah Minority Leader Angela Romero
Utah Division of Professional Licensing
U.S. Federal Trade Commission
U.S. Food and Drug Administration
[1]Letter from Alan Smith, Chair, Utah Medical Licensing Board, to Utah Department of Commerce, Office of Artificial Intelligence Policy (April 20, 2026), https://bit.ly/42VVxnO.
[2]Michelle M. Mello, Utah’s Experiment With AI-Driven Prescription Renewals, 7 JAMA Health Forum 1, 1-3 (2026).
Sara Gerke et al., Utah’s Prescription-Renewal Pilot Program — Autonomous AI Managing Patient Care, 394 The New England Journal of Medicine, 1561, 1561-1563 (2026).
[3]Sara Gerke et al., Utah’s Prescription-Renewal Pilot Program — Autonomous AI Managing Patient Care, 394 The New England Journal of Medicine, 1561, 1561-1563 (2026).
[4]Dimitris Giannitsas et al., In Artificial Intelligence (AI) We (Dis)trust? Navigating Institutional Pressures for Automation and Augmentation in the Implementation of AI in Organizations, 36 Information and Organization 1, 1-25 (2026).
[5]Moustafa Abdelwanis et al., Exploring the Risks of Automation Bias in Healthcare Artificial Intelligence Applications: A Bowtie Analysis, 5 Journal of Safety Science and Resilience 460, 460-469 (2024).
[6]Daniel G. Aaron and Christopher Robertson, The First AI Drug Prescriber, JAMA Viewpoint (April 13, 2026), https://bit.ly/4tkaj2o.
[7]Michelle M. Mello, Utah’s Experiment With AI-Driven Prescription Renewals, 7 JAMA Health Forum 1, 1-3 (2026).
[8]Michelle M. Mello, Utah’s Experiment With AI-Driven Prescription Renewals, 7 JAMA Health Forum 1, 1-3 (2026).
Sara Gerke et al., Utah’s Prescription-Renewal Pilot Program — Autonomous AI Managing Patient Care, 394 The New England Journal of Medicine, 1561, 1561-1563 (2026).
Stay Updated on Public Citizen
Follow Public Citizen
Support Our Work
Private Profiteers: How ICE Detention Center Contractors Exploit Immigrant Detainees with $1 Per Day Pay
By Douglas S. Pasternak
Most people would not work for $1 a day or 12.5 cents an hour, even in the worst of times. Immigrant detainees have no choice. Working for $1 a day in the government’s so-called Voluntary Work Program (VWP) while detained is the only option available to earn any money for the more than 60,000 immigrants held in hundreds of active detention centers across the United States by the Immigration and Customs Enforcement (ICE) agency.[1] Tens of thousands of detainees participate in the VWP because it is their only available source of income while in detention and they are often coerced into participating or threatened with retaliation if they refuse to participate.[2] Estimates vary, but approximately 50% of those detained for more than a few days typically end up working in ICE’s Voluntary Work Program.[3]
The private corporations managing the network of detention camps across the U.S. are profiting as a result, saving millions of dollars every year by not paying minimum wage to detainees or hiring outside help to maintain the basic operational requirements of the detention centers, including cooking, cleaning, maintenance, and other core activities that are essential to keeping the facilities operating. Instead, they pay $1 a day to detainees and reap huge financial benefits as a result. As the number of immigrants held in detention swells under the Trump administration the number of detainees in these programs also grows, along with the profits of the contractors.[4]
Immigrant detainees are held on civil charges not criminal charges. Some lack legal status, but many are lawful permanent residents of the United States with work authorization permits.[5] If they participate in ICE’s Voluntary Work Program they are normally paid $1 per day regardless of the number of hours they work.
In some instances, detainees have reportedly worked 14 hours a day for the same $1 per day pay. In many cases detainees may only use their earned wages to purchase basic necessities at corporate-run commissaries with inflated prices where toothpaste can cost $11 for a 4 oz. tube.[6] In addition, many detainees have alleged in lawsuits that they were threatened with solitary confinement, denied medical care, or loss of other privileges if they refused to work.[7]
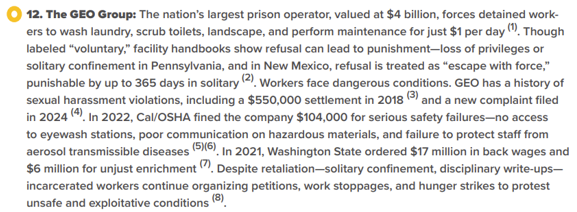
An estimated 86% of the more than 60,000 immigrant detainees currently held in custody are housed at detention centers run by a handful of for-profit corporations which are reaping immense financial benefits.[8] George Zoley, the executive chairman and founder of The GEO Group, for instance, the largest ICE detention facility contractor in the United States, made $11.3 million in compensation in 2025 alone, which equated to more than $5,400 per hour.[9] He and the company’s top five officials earned a total of more than $21 million in compensation last year.[10] Overall, GEO Group’s profits jumped from $32 million in 2024[11] to more than $254 million in 2025,[12] as the Trump administration dramatically expanded the number of ICE detention centers and government contracts exploded.[13]
CoreCivic is the second largest immigration detention center contractor in the United States. In 2025, the former CEO of CoreCivic, Damon Hininger, who retired at the end of last year, made $7.2 million in compensation.[14] The top five executives at CoreCivic earned more than $3 million each in compensation last year, for a combined total of $20.5 million.[15] The company’s profits grew from $68.9 million in 2024[16] to $116.5 million in 2025,[17] and both companies had well over $2 billion in revenue last year, with GEO Group earning $2.6 billion[18] and CoreCivic earning $2.2 billion.[19]
Although it is a federal crime to hire immigrants without work authorization, for-profit companies running America’s immigration centers are permitted to put immigrant detainees to work for just $1 a day, based on a 1950s era law.[20] The battle for just pay for immigrant detainees has been an ongoing issue for decades. Congress has failed to address this issue and U.S. courts have traditionally held that immigrant detainees are “volunteers” and not “workers,” which has denied them basic labor rights under the Fair Labor Standards Act of 1938, which mandates federal minimum wage requirements.[21] Over the past year, however, federal courts have reviewed several cases revolving around unjust pay and unfair treatment in federal immigrant detention centers.
Among Public Citizen’s key findings regarding the $1 a day pay issue for immigrant detainees are the following:
- There are currently seven federal court cases challenging the $1 a day pay in five states, including Washington, California, Colorado, Georgia, and New York.
- In February 2026, the S. Supreme Court issued a unanimous decision rejecting the GEO Group’s efforts to dismiss a class action lawsuit against it regarding the $1 a day pay issue at the Aurora Detention Facility in Colorado. This case will now proceed to a jury trial.[22]
- Last year, in January 2025, the 9th Circuit Court of Appeals, ruled that the GEO Group owes more than 10,000 current and former immigrant detainees who were housed at the Northwest ICE Processing Center in Tacoma, Washington, $17.3 million in back wages and $5.9 million to Washington state for “unjust enrichment” because they failed to pay the immigrant workers’ Washington state’s minimum wage, currently $17.13 per hour. In January 2026, the GEO Group appealed the case to the U.S. Supreme Court.[23]
- In several of the cases currently winding their way through federal courts immigrant detainees allege they were not paid at all for work they performed, and in multiple instances the lawsuits claim detainees were threatened or coerced into performing services for the private contractors running the immigration detention facilities, including threats of solitary confinement, loss of privileges, and denied medical care.[24]
- In December 2017, the Commission on Civil Rights called for a halt to the $1 a day pay saying they were “concerned” with “pressure” from private contractors running public immigrant detention centers and their efforts “to coerce detainees to perform labor in order to maximize profits,” and called for paying detainees a “fair wage.”[25]
- In January 2025, the National Labor Relations Board (NLRB) issued a formal complaint against the GEO Group, for retaliating against two immigrant detainees at the Mesa Verde Detention Center in California due to their support of a labor strike protesting the $1 a day wages and working conditions at the facility.[26] However, President Trump fired the NLRB’s General Counsel that filed the complaint and a Democratic NLRB board member that same month.[27] The NLRB officially withdrew its complaint in February 2025, one month after Trump took office for his second term.[28]
- The meager $1 a day pay that immigrant detainees receive is usually only good to acquire items at the corporate run commissary within the immigration detention centers that charge highly inflated prices for basic necessities and services. At these rates, it may take a detainee more than three days of work to purchase a can of tuna fish or more than two days of work to purchase a bar of soap.[29]
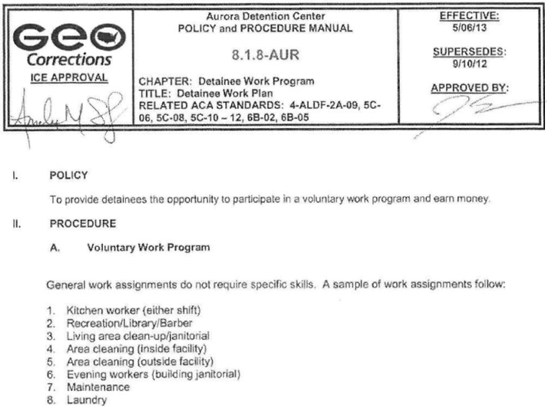
The Voluntary Work Program
All immigrant detainees are required to maintain their own individual living space ensuring that it is clean. Those involved in ICE’s VWP, however, perform “tasks that are essential to the operation of the facility,” according to the 9th Circuit Court of Appeals.[30] This may include various maintenance and operations activities, such as working as janitorial staff cleaning, stripping and waxing floors, preparing food, cooking meals, processing industrial laundry, cutting hair, working as library aides, or even performing clerical tasks for the private facility manager.[31]
Partial excerpts of a document that highlights a sampling of VWP jobs from ICE’s Aurora Detention Facility in Colorado run by the GEO Group is pasted below:
Commissary Price Gouging
How immigrant workers spend their meager $1 a day income is limited. Often their only option is to purchase items from a corporate-run commissary that has exorbitant mark-ups on basic goods and services. A Reuters story from 2019 found that a 4 oz. tube of Sensodyne Toothpaste, that cost $5.20 on Amazon, was being sold for $11.02 at the Stewart Detention Center in Lumpkin, Georgia run by CoreCivic, and was $9.00 at the Adelanto Detention Center in Adelanto, California run by GEO Group.[32] A “voluntary worker” at the Stewart Detention Center would have had to work full-time for eleven days earning $1 per day to afford to purchase a tube of toothpaste. [33]
Canned tuna costing $0.85 at Target was found to cost $3.25 at GEO Group’s Adelanto Detention Center and a $1.00 bar of soap at Target cost $2.44 at CoreCivic’s Stewart Detention Center.[34]
In addition, while the average cost of a phone call to Mexico is $0.05 to $0.10/minute, or free using online services, GEO Group’s Adelanto Detention Center charges an estimated $1.00/minute, an immigrant detainees’ full daily wage if they are enrolled in the Voluntary Work Program.[35]
Profit Motive
For-profit corporations operating immigrant detention centers save millions of dollars each year by paying detainees $1 per day for their work at these detention facilities. While the specific numbers are hard to pin down, in one lawsuit against the GEO Group in Washington State, GEO Group testified that it would have required an estimated 85 full-time employees if it did not utilize immigrant detainees at the facility.[36] If GEO paid these 85 workers the state’s minimum wage, which is currently $17.13 per hour it would have cost them a little over $3 million per year. By paying immigrant detainees $1 a day to perform the same work, GEO Group paid a total of $22,100 instead, permitting them to save more than $3 million at a single detention center.
The 9th Circuit Court of Appeals found that, “Because of the labor provided to GEO by the detained workers employed under this program, GEO operated its facility with just a handful of full-time staff hired from the local area, thereby saving millions of dollars that it would otherwise have spent on payroll.”[37] The court also determined that between 2010 and 2018, GEO’s profit margins hoovered between 16 to 19 percent each year.[38]
In this same case regarding GEO Group’s management of the Northwest ICE Processing Center in Tacoma, Washington, where Washington State as well as a class of detainees sued GEO Group for unfair wages and related issues, the court found GEO Group owed the detainees and the state a total of more than $23 million. Rather than acknowledging their wrongdoing, the GEO Group responded by halting the Voluntary Work Program at the facility altogether in lieu of paying the immigrant detainees minimum wage, according to a May 2023, Department of Homeland Security (DHS) Office of Inspector General (OIG) report.[39]
Another 2023 DHS OIG unannounced inspection at the Caroline Detention Center in Bowling Green, Virginia, operated by the Caroline County Government found that “Caroline did not follow standards related to the voluntary work program.”[40] “Volunteer” workers exceeded the 40-hour work week limit. In one case a detainee worked 65 hours in 1 week, and as long as 14 hours in a single day. Another detainee worked an average of 56 hours per week during a 6-week period. The over-work was a result of understaffing at the facility.
ICE responded to the OIG’s analysis and recommendation to correct these failings by asserting they make efforts not to work the detainees more than 40 hours per week, but that they are sometimes understaffed. In response, the OIG said it was concerned that “ICE openly disregards” the voluntary work standard and that their “recommendation remains unresolved and open….”[41]
The issues impacting these facilities, however, go beyond fair wages. They also revolve around health and safety. In April 2026, for instance, reports emerged that GEO Group was preventing inspectors from the Washington State Department of Health from entering the Northwest ICE Processing Center. According to King5 News, an NBC News affiliate station in Seattle, Washington, the state health inspectors have attempted to enter the facility nine times since 2023 and have been denied access each time. The most recent attempt came on March 20, 2026, when inspectors were once again denied entry.[42]
In addition, in December 2022, the GEO Group was fined more than $100,000 by the Occupational Safety and Health Administration (OSHA) for six separate citations, including one “willful” violation of health and safety protocols at the Golden State Annex ICE detention facility in Bakersfield, California.[43] The GEO Group contested all six citations and the current status of these citations is not known.[44]
Work But No Pay
Multiple lawsuits and other reporting have documented that sometimes immigrant detainees work at their detention facilities but are not paid at all. A joint report by the American Civil Liberties Union (ACLU), Human Rights Watch, and the National Immigrant Justice Center, detailing immigration detention under the Trump Administration, highlighted several examples of detainees not being paid even the $1 a day wage, for the work they performed.[45] Among the examples in the report:
- “Immigrants at Richwood Correctional Center and Winn Correctional Center, both run by LaSalle Corrections, reported that they had not received payment or had not received full payment for their labor, even at the rate of $1 per day. “I worked for a whole month in the kitchen but was paid only four dollars,” reported one man at Winn.
- Another person at Winn reported that he had not been paid for approximately five weeks of kitchen work.
- Several people at Richwood also reported that they had not received their promised payment. Oscar O., who worked in the kitchen at Richwood, explained that he was told he would be paid $1 per day, but that at times this money had not gone into his account.
- Sherman reported that he worked for a whole month cleaning the grounds at Richwood, but had only received $7 — payment for one week.
- Caleb D., who was detained at Tallahatchie County Correctional Facility, which is run by CoreCivic, said, “I’ve been working every day, but they haven’t paid [me] yet. I’m afraid not to work because they might think I am rebelling.”[46]
Retaliation Against Immigrant Detainees
The very notion that the Voluntary Work Program is “voluntary,” is considered a misnomer by the detainees who have worked in this program for two reasons. They point out that they need to work in the VWP even with its meager wages in order to purchase any of the basic necessities they require, such as soap, toothpaste and even feminine hygiene products, “which are not otherwise provided to detained immigrants,” according to a 2020 article in Georgetown University’s Immigration Law Journal.[47] In addition, detainees have alleged that the contractors running the ICE detention centers have retaliated against them if they refused to work for $1/day pay.[48] This retaliation has included threats of solitary confinement, loss of privileges, denied medical treatment, and other retaliatory actions.[49]
In January 2025, the National Labor Relations Board (NLRB) filed a formal complaint against GEO Group for retaliating against two workers at the Mesa Verde Detention Facility in Bakersfield, CA regarding the “Voluntary Work Program” because of their efforts in June 2022 to organize and support a labor strike to protest the $1 a day wages and the working conditions.[50] The complaint claimed GEO Group retaliated against Pedro Jesus Figueroa Padilla an immigrant detainee who was placed in “disciplinary segregation” for eight-days, transferred to another housing unit, and had his commissary privileges revoked as a result of his protests. Another immigrant detainee, Ruben Hernandez Gomez, was also retaliated against for supporting the labor strike, signing a petition to protest wages and work conditions, and filing a class-action lawsuit against the GEO Group regarding wage theft, underpayment, and forced labor.[51] For these actions Gomez was placed in solitary confinement.
However, President Trump fired the NLRB General Council, Jennifer Abruzzo, who brought the complaint, and Democratic NLRB board member Gwynne Wilcox, as soon as he took office in January 2025.[52] The NLRB officially withdrew the complaint in February 2025.[53] None of those political actions seemed to have a positive impact on GEO Group’s treatment of detainees.
Last year, The GEO Group, made the National Council for Occupational Safety and Health’s “Dirty Dozen” list of the 12 most “dangerous and reckless employers risking the lives of workers and communities.”[54] In its report, it wrote:
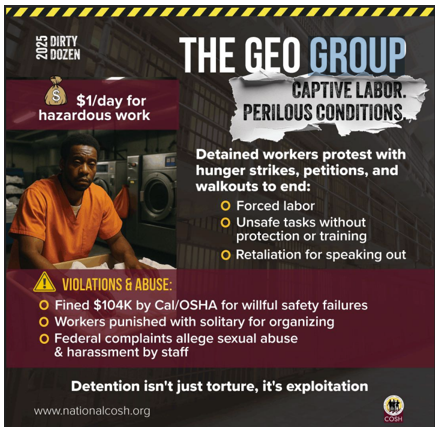
Detainees are Not Criminals
Immigrant detainees are generally paid at a rate exceedingly lower than even prisoners incarcerated in the United States today. Pay to those incarcerated in the U.S. varies tremendously by state ranging from $0.03 per hour to $0.97 an hour for work within a prison or jail.[55] Other estimates have found those incarcerated can earn between $0.33 cents and $1.41 per hour working for non-facility specific positions, for commercial companies.[56]
The vast majority of detainees have not engaged in non-immigration related crimes. According to the most recent data (as of April 4, 2026) from the Transactional Records Access Clearinghouse (TRAC) at Syracuse University, which monitors federal immigration data, 70% of current detainees have no criminal records and those with criminal records are often minor, including traffic violations.[57] In addition, in February 2026, just 2% of those immigrants that faced deportation proceedings initiated by the Department of Homeland Security (DHS) had non-immigration related criminal records.[58]
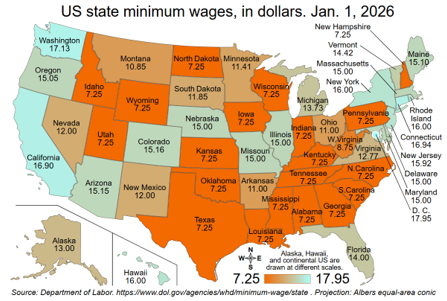
Minimum Wage & Minimal Justice
The federal minimum wage today is $7.25 per hour or $58 per day for an eight-hour shift.[59] A detained immigrant would need to work for 58 days to earn what a minimum wage worker earns in one day or more than one year to earn the $406 weekly paycheck of a minimum wage worker. In addition, minimum wage is as high as $17.95 per hour in Washington, D.C. and $17.13 per hour in Washington State. The map below shows the minimum wage rates in each state.[60]
Worker vs. Volunteer
Historically, U.S. courts have not considered immigrant detainees “workers” under the federal Fair Labor Standards Act of 1938.[61] However, more recent cases have found that detainees are due state minimum wage for work they perform in immigration detention centers. These cases are currently winding their way through the courts. Some of these cases have been appealed to the U.S. Supreme Court, some are in the discovery phase, and some cases are on their way to jury trials, which have not yet begun.
Many of the detainee lawsuits have claimed “unjust enrichment” on the part of the contractors running the detention facilities. Unjust enrichment is the “principle that a party cannot induce, accept, or encourage another to furnish or render something of value to such party and avoid payment for the value received,” according to Georgia State law.[62] Most legal definitions are similar. In the context of immigrant detainees, “unjust enrichment” suggests that the contractor at the facility that utilizes the services of immigrant detainees for just $1 per day obtained these services for an unjust amount of compensation. In addition, the 9th Circuit Court of Appeals found in January 2025 that there is nothing prohibiting GEO Group from paying detainees minimum wage and that their contract with ICE requires them to abide by both federal, state and local law, which would mandate paying minimum wage to immigrant detainees.[63]
Some of the ongoing lawsuits have also alleged forced labor, and even “slavery,” under the Trafficking Victims Protection Act (TVPA).[64] Dalila Yeend, a former immigrant detainee in the Buffalo Federal Detention Facility in New York, said this work and the pay “is bordering on slavery.”[65] One case was settled in 2023, another found that the TVPA did not apply to the Voluntary Work Program (VWP) detainees, and seven other cases in five states are ongoing.
A chart of the lawsuits regarding $1 a day wages to immigrant detainees can be found below.
Court Cases Challenging the $1 Per Day “Voluntary Work Program”
| FACILITY NAME | LOCATION | AVG. POPULATION | OPERATOR | LAWSUIT DETAILS | |
|---|---|---|---|---|---|
| Northwest ICE Processing Center (forerly Northwest Detention Center) | Tacoma, WA | 1,017 | GEO Group | Washington v. GEO Group & Nwauzor v. GEO Group | |
| The Washington Attorney General filed suit in 2017 against the GEO Group for violation of the state’s minimum wage law. In 2021 a federal jury awarded $17.3M to 10,000+ detainees and $5.9M to the state for “unjust enrichment” by GEO Group — a combined $23.2M judgment. In January 2025, the 9th Circuit Court of Appeals affirmed the case, and in August 2025 it denied a GEO Group request for a rehearing. On January 9, 2026, GEO Group filed its appeal or Petition for a Writ of Certiorari to the U.S. Supreme Court. | |||||
| Aurora Detention Facility | Aurora, CO | 1,000 | GEO Group | Menocal v. GEO Group | |
| A class action suit was filed in 2014 in the U.S. District Court for the District of Colorado under the Trafficking Victims Protection Act (TVPA) alleging forced labor and “unjust enrichment.” On February 25, 2026, the U.S. Supreme Court unanimously denied GEO Group’s request to dismiss the case based on the GEO Group’s argument that it had “sovereign immunity” in its role as a federal contractor. The case now proceeds to trial. This is the first TVPA forced labor case against an ICE contractor to reach the Supreme Court. A pretrial conference is set for June 3, 2026, and a final trial preparation conference is set for October 27, 2026. | |||||
| Adelanto ICE Processing Center | Adelanto, CA | 1,484 | GEO Group | Novoa v. GEO Group & Ramirez v. GEO Group | |
| Multiple class action suits were consolidated alleging minimum wage violations under California law and TVPA forced labor claims. The Novoa case was filed in 2017, and the Ramirez case was filed in 2018. The cases were stayed in the U.S. District Court for the Central District of California pending the outcome of the GEO Group’s appeal in the Washington State case. On January 9, 2026, GEO filed a Petition for Certiorari to the U.S. Supreme Court requesting they review the lower court’s decision. The 9th Circuit court case is stayed pending the disposition of GEO’s Petition for Certiorari to the U.S. Supreme Court. | |||||
| Mesa Verde ICE Processing Facility | Bakersfield, CA | 304 | GEO Group | Gomez v. GEO Group | |
| This case was filed in July 2022 in U.S. District Court for the Eastern District of California’s Fresno Division representing nine immigrants who were detained at both the Mesa Verde and Golden State Annex ICE facilities. Detainees allege unlawful wage theft, unjust enrichment, and forced labor. They allege they were forced to perform facility maintenance for $1/day or face disciplinary consequences, including loss of privileges. In 2022 and 2023 detainees held labor and hunger strikes protesting these conditions. Cases remain stayed pending GEO Group’s Washington State appeal which was filed with the U.S. Supreme Court on January 9, 2026. | |||||
| Golden State Annex | McFarland, CA | 529 | GEO Group | Gomez v. GEO Group | |
| This case was filed in 2022 in conjunction with the above case regarding the Mesa Verde ICE detention facility. As indicated above, the suit alleges forced labor and wage theft due to the $1/day payment to detainees for sanitation and maintenance work under the threat of retaliation, including solitary confinement, and loss of privileges if detainees refused to work. In addition, California’s Division of Occupational Safety and Health issued $100,000+ in citations against GEO Group following 2022 inspections, including a “willful” violation for failure to implement COVID-19 airborne disease protocols. The case remains stayed pending GEO Group’s Washington State appeal which was filed with the U.S. Supreme Court on January 9, 2026. | |||||
| Stewart Detention Center | Lumpkin, GA | 2,079 | CoreCivic | Barrientos v. CoreCivic | |
| Filed by the Southern Poverty Law Center in 2018 under the TVPA, alleging CoreCivic unjustly enriched itself and used coercion and threats of punishment, including solitary confinement and withholding access to basic necessities, to force detainees to work for $1/day cleaning the facility. The case was settled in October 2023. CoreCivic did not pay monetary damages but was required to post a formal ‘Declaration of Rights’ notifying detainees of their right to refuse to participate in the Voluntary Work Program. | |||||
| Otay Mesa Detention Center | San Diego, CA | 1,130 | CoreCivic | Owino v. CoreCivic | |
| Class action lawsuit filed in May 2017 in the U.S. District Court in the Southern District of California alleging CoreCivic’s VWP at Otay Mesa constituted forced labor under the TVPA and unjust enrichment under California law. In 2022, the 9th Circuit Court of Appeals ruled that the case could proceed as a class action, rejecting CoreCivic’s challenge to class certification. Discovery is ongoing. | |||||
| Cibola County Correctional Center | Milan, NM | 219 | CoreCivic | Ndambi v. CoreCivic | |
| In November 2018, several detainees filed a lawsuit in the U.S. District Court of Maryland in the Southern District alleging CoreCivic’s $1/day VWP violated the TVPA. The U.S. Court of Appeals for the 4th Circuit ruled adversely to the detainee in 2021, finding the TVPA did not apply to the VWP in this context — creating a circuit split with the 9th Circuit Court. The conflicting rulings increase the likelihood of a future Supreme Court ruling on these cases. (Although the detention facility is located in New Mexico, CoreCivic was organized as a Maryland corporation, which is where the lawsuit was filed.) | |||||
| Irwin County Detention Center | Ocilla, GA | 221 | LaSalle Corrections | Nilson Barahona, et. al., v. LaSalle Management Company, LLC, et. al. | |
| In March 2023, a lawsuit was filed in the U.S. District Court for the Middle District of Georgia against LaSalle by three immigrant detainees who had been held at the Irwin County Detention Center. The suit alleged the plaintiffs were forced to work for $1 per day and that refusal to work was met with threats of solitary conferment or lockdown in a detainee’s cell, threats of criminal prosecution for disobeying an officer’s order, downgrading a detainee’s housing, revoking access to the center’s commissary, and denying access to medical care. Discovery is now proceeding and is scheduled to be completed by April 16, 2027, with a tentative November 2027 trial date. | |||||
| Buffalo Federal Detention Facility | Batavia, NY | 678 | Akima Global Services, LLC | Yeend, et. al., v. Akima Global Services, LLC | |
| Plaintiffs filed this case in September 2020 in the New York State Supreme Court in Rensselaer County alleging unjust enrichment and incarcerated labor, stating that they were not paid fair wages for their time working at the Buffalo Federal Detention Facility operated by Akima Global Services LLC. The suit alleges that the detainees were given $1 a day in commissary credit for their labor, regardless of the number of hours they worked, and allege that this arrangement was “bordering on slavery.” The case was moved to the U.S. District Court for the Northern District of New York and remains active. No trial date has been set yet. | |||||
Profits & Politics
Regardless of the ultimate disposition of these lawsuits, immigration detention center contractors, particularly, GEO Group and CoreCivic, are benefitting financially from the Trump administration’s dramatic expansion of the detention camp complex. The Project on Government Oversight (POGO) released a report in February 2026 that looked at the top companies profitting from the Trump administration’s immigration crackdown.[77] The GEO Group was listed as number two (2) and CoreCivic was listed as number five (5).
According to POGO’s analysis, GEO Group received more than $710 million in ICE contracts from January 20, 2025, through January 19, 2026.[78] CoreCivic received nearly $269 million in ICE contracts during that same time-period. POGO’s investigation also found that the GEO Group, its’ executives and affiliated political action committees (PACs) made more than $1.6 million in donations to Trump-aligned PACs and Trump’s inauguration committee during the 2024 election cycle, while CoreCivic made more than $806,000 in similar donations. In addition, the GEO Group spent more than $3.6 million in lobbying expenditures last year, and CoreCivic spent slightly more, $3.7 million, in 2025 lobbying expenditures.[79]
The GEO Group has tried to influence the administration in other ways. Attorney General Pam Bondi lobbied, for instance, on behalf of the GEO Group in 2019 prior to her appointment as Attorney General in the Trump Administration while she was at Ballard Partners, LLC.[80]
The detention business has paid off well for companies such as GEO Group. Company co-founder George Zoley owns a 9-bedroom, 11-bathroom, 18,523 square foot home on more than 1-acre of land in Boca Raton, Florida, estimated to be worth more than $22.5 million.[81] The house is a “one-of-a-kind trophy estate” with “refined opulence,” according to Zillow. It includes an elevator, two laundry rooms, and a 4-bay garage, and 9 ½ to 23½ feet ceilings. Zillow describes the house this way:
“Embracing age-old ideals while artfully fashioned for today’s world, this expansive courtyard estate sprawls stately on a double lot along Royal Palm Yacht & Country Club’s championship golf course. Inspired by the majestic architecture and formal gardens of Miami’s landmark Vizcaya and other world acclaimed estates, this newly built compound was created under the direction of David Easton, an award-winning New York-based architect and interior designer lauded as one of America’s leading classicists and one of Architectural Digest’s AD 100 Designers.”[82]
Zoley’s home also includes iron gates, a statuesque formal great room, a series of terraces amid dramatic Italian formal gardens, a resort-style fountained pool with a mosaic-tiled spa under a garden pergola, a poolside cabana, and staff quarters, according to Zillow.
Palm Beach County property records indicate that the Boca Raton, Florida home is currently owned by Zoley.[83]
Conclusion
The disparity between Zoley’s wealth and the $1 per day pay to detained immigrants is striking. The tens of thousands of immigrants detained by the U.S. government deserve better than being paid $1 per day, and the federal contractors building an extensive network of detention camps across the country should not be making excessive profits at their expense.
ENDNOTES:
[1] “ICE Detention Trends,” VERA INSTITUTE OF JUSTICE (Updated April 2, 2026), https://www.vera.org/ice-detention-trends
[2] Jonathon Booth, “Ending Forced Labor in ICE Detention Centers: A New Approach,” IMMIGRATION LAW JOURNAL, Georgetown University, (August 19, 2020), https://www.law.georgetown.edu/immigration-law-journal/wp-content/uploads/sites/19/2020/08/ENDING-FORCED-LABOR-IN-ICE-DETENTION-CENTERS-A-NEW-APPROACH.pdf
[3] Ibid.
[4] Lauren-Brooke Eisen, “Private Prison Companies’ Enormous Windfall: Who Stands to Gain as ICE Expands,” BRENNEN CENTER FOR JUSTICE (October 1, 2025), https://www.brennancenter.org/our-work/analysis-opinion/private-prison-companies-enormous-windfall-who-stands-gain-ice-expands
[5] “Nwauzor v. GEO Group Inc.,” UNITED STATES COURT OF APPEALS, NINTH CIRCUIT, United States Court of Appeals, Ninth Circuit, No. 21-36024, No. 21-36025 (January 16, 2025), https://caselaw.findlaw.com/court/us-9th-circuit/116874882.html
[6] Michelle Conlin and Kristina Cooke, “$11 toothpaste: Immigrants pay big for basics at private ICE lock-ups,” REUTERS (January 18, 2019), https://www.reuters.com/article/world/11-toothpaste-immigrants-pay-big-for-basics-at-private-ice-lock-ups-idUSKCN1PC0DJ/
[7] Letter: “Re: Retaliation Against Individuals in Immigration Detention at Mesa Verde Detention Facility and Golden State Annex,” from American Civil Liberties Union (ACLU) or Northern and Southern California, Freedom for Immigrants, Centro Legal de la Raza, California Collaborative for Immigrant Justice, and Innovation Law Lab to Department of Homeland Security, et. al. (September 12, 2022), https://lofgren.house.gov/sites/evo-subsites/lofgren.house.gov/files/9.12.22%20Mesa%20Verde%20-%20Golden%20State%20CRCL%20Complaint%20FINAL.pdf
[8] “Immigration Detention Statistics: A Retrospective and a Look Forward,” TRANSACTIONAL RECORDS ACCESS CLEARINGHOUSE (TRAC), Syracuse University (February 21, 2025), https://tracreports.org/reports/753/
[9] GEO Group, Inc., SALARY.COM, https://www.salary.com/tools/executive-compensation-calculator/geo-group-inc-executive-salaries?year=2025#google_vignette
[10] Ibid.
[11] “The Geo Group Reports Fourth Quarter and Full Year 2024 Results,” Press Release, THE GEO GROUP, INC. (February 27, 2025), https://www.sec.gov/Archives/edgar/data/923796/000119312525037537/d886579dex991.htm
[12] “The GEO Group Reports Fourth Quarter and Full Year 2025 Results,” NASDAQ (February 12, 2026), https://www.nasdaq.com/press-release/geo-group-reports-fourth-quarter-and-full-year-2025-results-2026-02-12
[13] Nick Schwellenbach, Luisa Clausen, and Aarushi Sahejpal, “ICE, Inc.: The Top Companies Profiting from Trump’s Immigration Crackdown,” PROJECT ON GOVERNMENT OVERSIGHT (POGO) (February 17, 2026), https://www.pogo.org/investigates/ice-inc-the-top-companies-profiting-from-trumps-immigration-crackdown
[14] CoreCivic, Inc., SALARY.COM, https://www.salary.com/research/executive-compensation/corecivic-inc-executive-salary
[15] Ibid.
[16] “CoreCivic Reports Fourth Quarter and Full Year 2024 Financial Results,” Press Release, CORECIVIC, INC., (February 10, 2025), https://www.sec.gov/Archives/edgar/data/1070985/000119312525023677/d518529dex991.htm
[17] “CoreCivic, Inc. SEC 10-K Report,” TRADINGVIEW (February 20, 2026), https://www.tradingview.com/news/tradingview:3fa0e7c2be8aa:0-corecivic-inc-sec-10-k-report/
[18] “The GEO Group Reports Fourth Quarter and Full Year 2025 Results,” NASDAQ (February 12, 2026), https://www.nasdaq.com/press-release/geo-group-reports-fourth-quarter-and-full-year-2025-results-2026-02-12
[19] “CoreCivic, Inc. SEC 10-K Report,” TRADINGVIEW (February 20, 2026), https://www.tradingview.com/news/tradingview:3fa0e7c2be8aa:0-corecivic-inc-sec-10-k-report/
[20] “8 USC 1555: Immigration Service expenses,” Office of the Law Revision Counsel, United States Code, U.S. HOUSE OF REPRESENTATIVES, https://uscode.house.gov/view.xhtml?req=granuleid:USC-prelim-title8-section1555&num=0&edition=prelim
[21] Fair Labor Standards Act of 1936, As Amended, U.S. HOUR AND WAGE DIVISION, Department of Labor, https://www.dol.gov/sites/dolgov/files/WHD/legacy/files/FairLaborStandAct.pdf
[22] “Supreme Court rules against private prison firm alleged to have forced immigrant detainees to work for $1 a day Politics,” PBS NEWS (February 25, 2026), https://www.pbs.org/newshour/politics/supreme-court-rules-against-private-prison-firm-alleged-to-have-forced-immigrant-detainees-to-work-for-1-a-day and Josh Gerstein, “Supreme Court deals setback to ICE detention contractor in fight over detainee work,” POLITICO (February 25, 2026), https://www.politico.com/news/2026/02/25/supreme-court-ruling-ice-detention-contractor-00797951
[23] Ugochukwu Nwauzor v. The GEO Group, Inc. (21-36024), Court of Appeals for the Ninth Circuit, COURT LISTENER, https://www.courtlistener.com/docket/65407093/ugochukwu-nwauzor-v-the-geo-group-inc/
[24] Letter: “Re: Retaliation Against Individuals in Immigration Detention at Mesa Verde Detention Facility and Golden State Annex,” from American Civil Liberties Union (ACLU) or Northern and Southern California, Freedom for Immigrants, Centro Legal de la Raza, California Collaborative for Immigrant Justice, and Innovation Law Lab to Department of Homeland Security, et. al. (September 12, 2022), https://lofgren.house.gov/sites/evo-subsites/lofgren.house.gov/files/9.12.22%20Mesa%20Verde%20-%20Golden%20State%20CRCL%20Complaint%20FINAL.pdf
[25] “U.S. Commission on Civil Rights Concerned with Alleged Abusive Labor Practices at Immigration Detention Centers,” Statement, U.S. COMMISSION ON CIVIL RIGHTS (December 21, 2017), https://www.usccr.gov/files/press/2017/12-21-PR.pdf
[26] “National Labor Relations Board Files Complaint Against GEO Group for Retaliation Against Workers at Mesa Verde Detention Facility,” CALIFORNIA COLLABORATIVE FOR IMMIGRANT JUSTICE (CCIJ) (January 9, 2025; Updated: January 14, 2025), https://www.ccijustice.org/post/nlrb-complaint-against-geo
[27] Stacy Maiers, “President Trump ousts NLRB board member, general counsel,” NATIONAL EDUCATION ASSOCIATION (January 28, 2025), https://www.nea.org/about-nea/media-center/press-releases/president-trump-ousts-nlrb-board-member-general-counsel
[28] Josh Eidelson, “US Labor Board Drops Case Over Prison Company’s Treatment of Detained Immigrants,” BLOOMBERG (March 19, 2025), (as retrieved on yahoo!news) https://www.yahoo.com/news/us-labor-board-drops-case-223012134.html
[29] Michelle Conlin and Kristina Cooke, “$11 toothpaste: Immigrants pay big for basics at private ICE lock-ups,” REUTERS (January 18, 2019), https://www.reuters.com/article/world/11-toothpaste-immigrants-pay-big-for-basics-at-private-ice-lock-ups-idUSKCN1PC0DJ/
[30] “Nwauzor v. GEO Group Inc.,” UNITED STATES COURT OF APPEALS, NINTH CIRCUIT, United States Court of Appeals, Ninth Circuit, No. 21-36024, No. 21-36025 (January 16, 2025), https://caselaw.findlaw.com/court/us-9th-circuit/116874882.html
[31] See: “Nwauzor v. GEO Group Inc.,” UNITED STATES COURT OF APPEALS, NINTH CIRCUIT, United States Court of Appeals, Ninth Circuit, No. 21-36024, No. 21-36025 (January 16, 2025), https://caselaw.findlaw.com/court/us-9th-circuit/116874882.html and Jonathon Booth, “Ending Forced Labor in ICE Detention Centers: A New Approach,” IMMIGRATION LAW JOURNAL, Georgetown University, (August 19, 2020), https://www.law.georgetown.edu/immigration-law-journal/wp-content/uploads/sites/19/2020/08/ENDING-FORCED-LABOR-IN-ICE-DETENTION-CENTERS-A-NEW-APPROACH.pdf
[32] Michelle Conlin and Kristina Cooke, “$11 toothpaste: Immigrants pay big for basics at private ICE lock-ups,” REUTERS (January 18, 2019), https://www.reuters.com/article/world/11-toothpaste-immigrants-pay-big-for-basics-at-private-ice-lock-ups-idUSKCN1PC0DJ/
[33] Ibid.
[34] Ibid.
[35] Ibid.
[36] See: “Nwauzor v. GEO Group Inc.,” UNITED STATES COURT OF APPEALS, NINTH CIRCUIT, United States Court of Appeals, Ninth Circuit, No. 21-36024, No. 21-36025 (January 16, 2025), https://caselaw.findlaw.com/court/us-9th-circuit/116874882.html and McKenzie Funk, “An ICE Contractor Is Worth Billions. It’s Still Fighting to Pay Detainees as Little as $1 a Day to Work,” PROPUBLICA (March 19, 2025) https://www.propublica.org/article/geo-group-ice-detainees-wage
[37] “Nwauzor v. GEO Group Inc.,” UNITED STATES COURT OF APPEALS, NINTH CIRCUIT, United States Court of Appeals, Ninth Circuit, No. 21-36024, No. 21-36025 (January 16, 2025), https://caselaw.findlaw.com/court/us-9th-circuit/116874882.html
[38] Ibid.
[39] Results of an Unannounced Inspection of Northwest ICE Processing Center in Tacoma, Washington,” OFFICE OF INSPECTOR GENERAL, Department of Homeland Security, OIG-23-26 (May 22, 2023), https://www.oig.dhs.gov/sites/default/files/assets/2023-05/OIG-23-26-May23.pdf
[40] “Results of an Unannounced Inspection of ICE’s Caroline Detention Facility in Bowling Green, Virginia,” Department of Homeland Security, OFFICE OF INSPECTOR GENERAL, OIG-23-51 (September 15, 2023), https://www.oig.dhs.gov/sites/default/files/assets/2023-09/OIG-23-51-Sep23.pdf
[41] Ibid.
[42] Sharon Yoo, “Washington wins court fight to inspect Tacoma ICE detention center but inspectors still blocked from entry,” KING5 NEWS (April 9, 2026), https://www.king5.com/article/news/community/facing-race/washington-immigration/tacoma-ice-detention-center-inspectors-blocked/281-79899ede-2b33-494a-bd05-3addcf7bbda1
[43] “Inspection: 1609228.015 – The Geo Group, Inc. Dba Golden State Annex,” OCCUPATIONAL SAFETY & HEALTH ADMINISTRATION (OSHA) (June 15, 2022), https://www.osha.gov/ords/imis/establishment.inspection_detail?id=1609228.015
[44] Ibid.
[45] “Justice-Free Zones: U.S. Immigration Detention Under the Trump Administration,” AMERICAN CIVIL LIBERTIES UNION (ACLU), May 2022, https://immigrantjustice.org/wp-content/uploads/2025/05/Justice-Free-Zones_Immigrant_Detention_Report_ACLU-HRW-NIJC_April-2020.pdf
[46] Ibid.
[47] Jonathon Booth, “Ending Forced Labor in ICE Detention Centers: A New Approach,” IMMIGRATION LAW JOURNAL, Georgetown University, (August 19, 2020), https://www.law.georgetown.edu/immigration-law-journal/wp-content/uploads/sites/19/2020/08/ENDING-FORCED-LABOR-IN-ICE-DETENTION-CENTERS-A-NEW-APPROACH.pdf
[48] Letter: “Re: Retaliation Against Individuals in Immigration Detention at Mesa Verde Detention Facility and Golden State Annex,” from American Civil Liberties Union (ACLU) or Northern and Southern California, Freedom for Immigrants, Centro Legal de la Raza, California Collaborative for Immigrant Justice, and Innovation Law Lab to Department of Homeland Security, et. al. (September 12, 2022), https://lofgren.house.gov/sites/evo-subsites/lofgren.house.gov/files/9.12.22%20Mesa%20Verde%20-%20Golden%20State%20CRCL%20Complaint%20FINAL.pdf
[49] Ibid.
[50] “National Labor Relations Board Files Complaint Against GEO Group for Retaliation Against Workers at Mesa Verde Detention Facility,” CALIFORNIA COLLABORATIVE FOR IMMIGRANT JUSTICE (CCIJ) (January 9, 2025; Updated: January 14, 2025), https://www.ccijustice.org/post/nlrb-complaint-against-geo
[51] Ibid.
[52] Stacy Maiers, “President Trump ousts NLRB board member, general counsel,” NATIONAL EDUCATION ASSOCIATION (January 28, 2025), https://www.nea.org/about-nea/media-center/press-releases/president-trump-ousts-nlrb-board-member-general-counsel
[53] Josh Eidelson, “US Labor Board Drops Case Over Prison Company’s Treatment of Detained Immigrants,” BLOOMBERG (March 19, 2025), (as retrieved on yahoo!news) https://www.yahoo.com/news/us-labor-board-drops-case-223012134.html
[54] “Dirty Dozen: Dangerous and Reckless Employers Risking the Lives of Workers and Communities,” NATIONAL COUNCIL FOR OCCUPATIONAL SAFETY AND HEALTH (NATIONAL COSH) (2025), https://nationalcosh.org/dd25
[55] Matthew Saleh, Timothy McNutt and Alex Herazy, “Subminimum Wages in New York State Prisons,”
Center for Applied Research on Work (CAROW), CORNELL UNIVERSITY, (May 14, 2024), https://www.ilr.cornell.edu/carow/carow-policy/subminimum-wages-new-york-state-prisons
[56] Wendy Sawyer, “How much do incarcerated people earn in each state?” PRISON POLICY INSTITUTE (April 10, 2017), https://www.prisonpolicy.org/blog/2017/04/10/wages/#:~:text=Incarcerated%20people%20assigned%20to%20work,the%20institutions%20that%20confine%20them.
[57] “Immigration Detention Quick Facts,” TRANSACTIONAL RECORDS ACCESS CLEARINGHOUSE (TRAC), Syracuse University (April 4, 2026), https://tracreports.org/immigration/quickfacts/detention.html#detention_nocrim
[58] “Just 2% of Immigration Court Filings Based on Alleged Criminal Activity in February 2026,” TRANSACTIONAL RECORDS ACCESS CLEARINGHOUSE, Syracuse University (April 7, 2026), https://tracreports.org/reports/771/
[59] “State Minimum Wage Laws,” Wage and Hour Division, U.S. DEPARTMENT OF LABOR, https://www.dol.gov/agencies/whd/minimum-wage/state
[60] Ibid.
[61] Fair Labor Standards Act of 1936, As Amended, U.S. HOUR AND WAGE DIVISION, Department of Labor, https://www.dol.gov/sites/dolgov/files/WHD/legacy/files/FairLaborStandAct.pdf
[62] Nilson Barahona, et. al., v. LaSalle Management Company, et. al., ORDER, U.S. DISTRICT COURT FOR THE MIDDLE DISTRICT OF GEORGIA, VALDOSTA DIVISION, (March 31, 2025), https://www.govinfo.gov/content/pkg/USCOURTS-gamd-7_23-cv-00024/pdf/USCOURTS-gamd-7_23-cv-00024-5.pdf
[63] “Nwauzor v. GEO Group Inc.,” UNITED STATES COURT OF APPEALS, NINTH CIRCUIT, United States Court of Appeals, Ninth Circuit, No. 21-36024, No. 21-36025 (January 16, 2025), https://caselaw.findlaw.com/court/us-9th-circuit/116874882.html
[64] Human Trafficking: Key Legislation, U.S. DEPARTMENT OF JUSTICE, https://www.justice.gov/humantrafficking/key-legislation
[65] Massarah Mikati, “‘Borders on slavery’: Suit claims labor violations at Batavia immigration facility,” OLEAN TIMES HERALD (September 4, 2020), https://www.oleantimesherald.com/2020/09/04/borders-on-slavery-suit-claims-labor-violations-at-batavia-immigration-facility/
[66] “ICE Detention Trends,” VERA INSTITUTE OF JUSTICE (Updated April 2, 2026), https://www.vera.org/ice-detention-trends
[67] Ugochukwu Nwauzor v. The GEO Group, Inc. (21-36024), Court of Appeals for the Ninth Circuit, COURT LISTENER, https://www.courtlistener.com/docket/65407093/ugochukwu-nwauzor-v-the-geo-group-inc/
[68] Menocal v. The GEO Group, Inc. (1:14-cv-02887), U.S. District Court for the District of Colorado, COURT LISTENER, https://www.courtlistener.com/docket/4196461/menocal-v-the-geo-group-inc/
[69] Raul Novoa v. The GEO Group, Inc. (5:17-cv-02514), U.S. District Court for the Central District of California, COURT LISTENER, https://www.courtlistener.com/docket/6244853/raul-novoa-v-the-geo-group-inc/
[70] Hernandez Gomez v. The GEO Group, Inc. (1:22-cv-00868), U.S. District Court for the Eastern District of California, COURT LISTENER, https://www.courtlistener.com/docket/63593326/hernandez-gomez-v-the-geo-group-inc/
[71] Ibid.
[72] Barrientos v. CoreCivic, Inc. (4:18-cv-00070), U.S. District Court for the Middle District of Georgia, COURT LISTENER, https://www.courtlistener.com/docket/6384840/barrientos-v-corecivic-inc/
[73] Owino v. CoreCivic, Inc. (3:17-cv-01112), U.S. District Court for the Southern District of California, COURT LISTENER, https://www.courtlistener.com/docket/6127721/owino-v-corecivic-inc/
[74] Ndambi v. CoreCivic, Inc. (1:18-cv-03521), U.S. District Court for the District of Maryland, COURT LISTENER, https://www.courtlistener.com/docket/8218504/ndambi-v-corecivic-inc/
[75] Barahona, et. al. v. LaSalle Management Company, LLC et al., U.S. District Court for the Middle District of Georgia, JUSTIA, https://dockets.justia.com/docket/georgia/gamdce/7:2023cv00024/128616
[76] Yeend v. Akima Global Services, LLC (25-1061), U.S. Court of Appeals for the Second Circuit Court, COURT LISTENER, https://www.courtlistener.com/docket/71868270/yeend-v-akima-global-services-llc/
[77] Nick Schwellenbach, Luisa Clausen, and Aarushi Sahejpal, “ICE, Inc.: The Top Companies Profiting from Trump’s Immigration Crackdown,” PROJECT ON GOVERNMENT OVERSIGHT (POGO) (February 17, 2026), https://www.pogo.org/investigates/ice-inc-the-top-companies-profiting-from-trumps-immigration-crackdown
[78] Ibid.
[79] Ibid.
[80] Jon Golinger, “Conflicted Justice: U.S. Attorney General-Nominee Pam Bondi’s Problematic Corporate Lobbying Clients,” PUBLIC CITIZEN (January 8, 2025), https://www.citizen.org/article/conflicted-justice/
[81] Zillow.com, https://www.zillow.com/homedetails/1515-Fan-Palm-Rd-Boca-Raton-FL-33432/46724402_zpid/
[82] Ibid.
[83] Property Detail, George Zoley, PALM BEACH COUNTY PROPERTY APPRAISER, https://pbcpao.gov/Property/Summary?parcelId=06434729100170160
Most people would not work for $1 a day or 12.5 cents an hour, even in the worst of times. Immigrant detainees have no choice. Working for $1 a day in the government’s so-called Voluntary Work Program (VWP) while detained is the only option available to earn any money for the more than 60,000 immigrants held in hundreds of active detention centers across the United States by the Immigration and Customs Enforcement (ICE) agency.[1] Tens of thousands of detainees participate in the VWP because it is their only available source of income while in detention and they are often coerced into participating or threatened with retaliation if they refuse to participate.[2] Estimates vary, but approximately 50% of those detained for more than a few days typically end up working in ICE’s Voluntary Work Program.[3]
The private corporations managing the network of detention camps across the U.S. are profiting as a result, saving millions of dollars every year by not paying minimum wage to detainees or hiring outside help to maintain the basic operational requirements of the detention centers, including cooking, cleaning, maintenance, and other core activities that are essential to keeping the facilities operating. Instead, they pay $1 a day to detainees and reap huge financial benefits as a result. As the number of immigrants held in detention swells under the Trump administration the number of detainees in these programs also grows, along with the profits of the contractors.[4]
Immigrant detainees are held on civil charges not criminal charges. Some lack legal status, but many are lawful permanent residents of the United States with work authorization permits.[5] If they participate in ICE’s Voluntary Work Program they are normally paid $1 per day regardless of the number of hours they work.
In some instances, detainees have reportedly worked 14 hours a day for the same $1 per day pay. In many cases detainees may only use their earned wages to purchase basic necessities at corporate-run commissaries with inflated prices where toothpaste can cost $11 for a 4 oz. tube.[6] In addition, many detainees have alleged in lawsuits that they were threatened with solitary confinement, denied medical care, or loss of other privileges if they refused to work.[7]
An estimated 86% of the more than 60,000 immigrant detainees currently held in custody are housed at detention centers run by a handful of for-profit corporations which are reaping immense financial benefits.[8] George Zoley, the executive chairman and founder of The GEO Group, for instance, the largest ICE detention facility contractor in the United States, made $11.3 million in compensation in 2025 alone, which equated to more than $5,400 per hour.[9] He and the company’s top five officials earned a total of more than $21 million in compensation last year.[10] Overall, GEO Group’s profits jumped from $32 million in 2024[11] to more than $254 million in 2025,[12] as the Trump administration dramatically expanded the number of ICE detention centers and government contracts exploded.[13]
CoreCivic is the second largest immigration detention center contractor in the United States. In 2025, the former CEO of CoreCivic, Damon Hininger, who retired at the end of last year, made $7.2 million in compensation.[14] The top five executives at CoreCivic earned more than $3 million each in compensation last year, for a combined total of $20.5 million.[15] The company’s profits grew from $68.9 million in 2024[16] to $116.5 million in 2025,[17] and both companies had well over $2 billion in revenue last year, with GEO Group earning $2.6 billion[18] and CoreCivic earning $2.2 billion.[19]
Although it is a federal crime to hire immigrants without work authorization, for-profit companies running America’s immigration centers are permitted to put immigrant detainees to work for just $1 a day, based on a 1950s era law.[20] The battle for just pay for immigrant detainees has been an ongoing issue for decades. Congress has failed to address this issue and U.S. courts have traditionally held that immigrant detainees are “volunteers” and not “workers,” which has denied them basic labor rights under the Fair Labor Standards Act of 1938, which mandates federal minimum wage requirements.[21] Over the past year, however, federal courts have reviewed several cases revolving around unjust pay and unfair treatment in federal immigrant detention centers.
Among Public Citizen’s key findings regarding the $1 a day pay issue for immigrant detainees are the following:
- There are currently seven federal court cases challenging the $1 a day pay in five states, including Washington, California, Colorado, Georgia, and New York.
- In February 2026, the S. Supreme Court issued a unanimous decision rejecting the GEO Group’s efforts to dismiss a class action lawsuit against it regarding the $1 a day pay issue at the Aurora Detention Facility in Colorado. This case will now proceed to a jury trial.[22]
- Last year, in January 2025, the 9th Circuit Court of Appeals, ruled that the GEO Group owes more than 10,000 current and former immigrant detainees who were housed at the Northwest ICE Processing Center in Tacoma, Washington, $17.3 million in back wages and $5.9 million to Washington state for “unjust enrichment” because they failed to pay the immigrant workers’ Washington state’s minimum wage, currently $17.13 per hour. In January 2026, the GEO Group appealed the case to the U.S. Supreme Court.[23]
- In several of the cases currently winding their way through federal courts immigrant detainees allege they were not paid at all for work they performed, and in multiple instances the lawsuits claim detainees were threatened or coerced into performing services for the private contractors running the immigration detention facilities, including threats of solitary confinement, loss of privileges, and denied medical care.[24]
- In December 2017, the Commission on Civil Rights called for a halt to the $1 a day pay saying they were “concerned” with “pressure” from private contractors running public immigrant detention centers and their efforts “to coerce detainees to perform labor in order to maximize profits,” and called for paying detainees a “fair wage.”[25]
- In January 2025, the National Labor Relations Board (NLRB) issued a formal complaint against the GEO Group, for retaliating against two immigrant detainees at the Mesa Verde Detention Center in California due to their support of a labor strike protesting the $1 a day wages and working conditions at the facility.[26] However, President Trump fired the NLRB’s General Counsel that filed the complaint and a Democratic NLRB board member that same month.[27] The NLRB officially withdrew its complaint in February 2025, one month after Trump took office for his second term.[28]
- The meager $1 a day pay that immigrant detainees receive is usually only good to acquire items at the corporate run commissary within the immigration detention centers that charge highly inflated prices for basic necessities and services. At these rates, it may take a detainee more than three days of work to purchase a can of tuna fish or more than two days of work to purchase a bar of soap.[29]
The Voluntary Work Program
All immigrant detainees are required to maintain their own individual living space ensuring that it is clean. Those involved in ICE’s VWP, however, perform “tasks that are essential to the operation of the facility,” according to the 9th Circuit Court of Appeals.[30] This may include various maintenance and operations activities, such as working as janitorial staff cleaning, stripping and waxing floors, preparing food, cooking meals, processing industrial laundry, cutting hair, working as library aides, or even performing clerical tasks for the private facility manager.[31]
Partial excerpts of a document that highlights a sampling of VWP jobs from ICE’s Aurora Detention Facility in Colorado run by the GEO Group is pasted below:
Commissary Price Gouging
How immigrant workers spend their meager $1 a day income is limited. Often their only option is to purchase items from a corporate-run commissary that has exorbitant mark-ups on basic goods and services. A Reuters story from 2019 found that a 4 oz. tube of Sensodyne Toothpaste, that cost $5.20 on Amazon, was being sold for $11.02 at the Stewart Detention Center in Lumpkin, Georgia run by CoreCivic, and was $9.00 at the Adelanto Detention Center in Adelanto, California run by GEO Group.[32] A “voluntary worker” at the Stewart Detention Center would have had to work full-time for eleven days earning $1 per day to afford to purchase a tube of toothpaste. [33]
Canned tuna costing $0.85 at Target was found to cost $3.25 at GEO Group’s Adelanto Detention Center and a $1.00 bar of soap at Target cost $2.44 at CoreCivic’s Stewart Detention Center.[34]
In addition, while the average cost of a phone call to Mexico is $0.05 to $0.10/minute, or free using online services, GEO Group’s Adelanto Detention Center charges an estimated $1.00/minute, an immigrant detainees’ full daily wage if they are enrolled in the Voluntary Work Program.[35]
Profit Motive
For-profit corporations operating immigrant detention centers save millions of dollars each year by paying detainees $1 per day for their work at these detention facilities. While the specific numbers are hard to pin down, in one lawsuit against the GEO Group in Washington State, GEO Group testified that it would have required an estimated 85 full-time employees if it did not utilize immigrant detainees at the facility.[36] If GEO paid these 85 workers the state’s minimum wage, which is currently $17.13 per hour it would have cost them a little over $3 million per year. By paying immigrant detainees $1 a day to perform the same work, GEO Group paid a total of $22,100 instead, permitting them to save more than $3 million at a single detention center.
The 9th Circuit Court of Appeals found that, “Because of the labor provided to GEO by the detained workers employed under this program, GEO operated its facility with just a handful of full-time staff hired from the local area, thereby saving millions of dollars that it would otherwise have spent on payroll.”[37] The court also determined that between 2010 and 2018, GEO’s profit margins hoovered between 16 to 19 percent each year.[38]
In this same case regarding GEO Group’s management of the Northwest ICE Processing Center in Tacoma, Washington, where Washington State as well as a class of detainees sued GEO Group for unfair wages and related issues, the court found GEO Group owed the detainees and the state a total of more than $23 million. Rather than acknowledging their wrongdoing, the GEO Group responded by halting the Voluntary Work Program at the facility altogether in lieu of paying the immigrant detainees minimum wage, according to a May 2023, Department of Homeland Security (DHS) Office of Inspector General (OIG) report.[39]
Another 2023 DHS OIG unannounced inspection at the Caroline Detention Center in Bowling Green, Virginia, operated by the Caroline County Government found that “Caroline did not follow standards related to the voluntary work program.”[40] “Volunteer” workers exceeded the 40-hour work week limit. In one case a detainee worked 65 hours in 1 week, and as long as 14 hours in a single day. Another detainee worked an average of 56 hours per week during a 6-week period. The over-work was a result of understaffing at the facility.
ICE responded to the OIG’s analysis and recommendation to correct these failings by asserting they make efforts not to work the detainees more than 40 hours per week, but that they are sometimes understaffed. In response, the OIG said it was concerned that “ICE openly disregards” the voluntary work standard and that their “recommendation remains unresolved and open….”[41]
The issues impacting these facilities, however, go beyond fair wages. They also revolve around health and safety. In April 2026, for instance, reports emerged that GEO Group was preventing inspectors from the Washington State Department of Health from entering the Northwest ICE Processing Center. According to King5 News, an NBC News affiliate station in Seattle, Washington, the state health inspectors have attempted to enter the facility nine times since 2023 and have been denied access each time. The most recent attempt came on March 20, 2026, when inspectors were once again denied entry.[42]
In addition, in December 2022, the GEO Group was fined more than $100,000 by the Occupational Safety and Health Administration (OSHA) for six separate citations, including one “willful” violation of health and safety protocols at the Golden State Annex ICE detention facility in Bakersfield, California.[43] The GEO Group contested all six citations and the current status of these citations is not known.[44]
Work But No Pay
Multiple lawsuits and other reporting have documented that sometimes immigrant detainees work at their detention facilities but are not paid at all. A joint report by the American Civil Liberties Union (ACLU), Human Rights Watch, and the National Immigrant Justice Center, detailing immigration detention under the Trump Administration, highlighted several examples of detainees not being paid even the $1 a day wage, for the work they performed.[45] Among the examples in the report:
- “Immigrants at Richwood Correctional Center and Winn Correctional Center, both run by LaSalle Corrections, reported that they had not received payment or had not received full payment for their labor, even at the rate of $1 per day. “I worked for a whole month in the kitchen but was paid only four dollars,” reported one man at Winn.
- Another person at Winn reported that he had not been paid for approximately five weeks of kitchen work.
- Several people at Richwood also reported that they had not received their promised payment. Oscar O., who worked in the kitchen at Richwood, explained that he was told he would be paid $1 per day, but that at times this money had not gone into his account.
- Sherman reported that he worked for a whole month cleaning the grounds at Richwood, but had only received $7 — payment for one week.
- Caleb D., who was detained at Tallahatchie County Correctional Facility, which is run by CoreCivic, said, “I’ve been working every day, but they haven’t paid [me] yet. I’m afraid not to work because they might think I am rebelling.”[46]
Retaliation Against Immigrant Detainees
The very notion that the Voluntary Work Program is “voluntary,” is considered a misnomer by the detainees who have worked in this program for two reasons. They point out that they need to work in the VWP even with its meager wages in order to purchase any of the basic necessities they require, such as soap, toothpaste and even feminine hygiene products, “which are not otherwise provided to detained immigrants,” according to a 2020 article in Georgetown University’s Immigration Law Journal.[47] In addition, detainees have alleged that the contractors running the ICE detention centers have retaliated against them if they refused to work for $1/day pay.[48] This retaliation has included threats of solitary confinement, loss of privileges, denied medical treatment, and other retaliatory actions.[49]
In January 2025, the National Labor Relations Board (NLRB) filed a formal complaint against GEO Group for retaliating against two workers at the Mesa Verde Detention Facility in Bakersfield, CA regarding the “Voluntary Work Program” because of their efforts in June 2022 to organize and support a labor strike to protest the $1 a day wages and the working conditions.[50] The complaint claimed GEO Group retaliated against Pedro Jesus Figueroa Padilla an immigrant detainee who was placed in “disciplinary segregation” for eight-days, transferred to another housing unit, and had his commissary privileges revoked as a result of his protests. Another immigrant detainee, Ruben Hernandez Gomez, was also retaliated against for supporting the labor strike, signing a petition to protest wages and work conditions, and filing a class-action lawsuit against the GEO Group regarding wage theft, underpayment, and forced labor.[51] For these actions Gomez was placed in solitary confinement.
However, President Trump fired the NLRB General Council, Jennifer Abruzzo, who brought the complaint, and Democratic NLRB board member Gwynne Wilcox, as soon as he took office in January 2025.[52] The NLRB officially withdrew the complaint in February 2025.[53] None of those political actions seemed to have a positive impact on GEO Group’s treatment of detainees.
Last year, The GEO Group, made the National Council for Occupational Safety and Health’s “Dirty Dozen” list of the 12 most “dangerous and reckless employers risking the lives of workers and communities.”[54] In its report, it wrote:
Detainees are Not Criminals
Immigrant detainees are generally paid at a rate exceedingly lower than even prisoners incarcerated in the United States today. Pay to those incarcerated in the U.S. varies tremendously by state ranging from $0.03 per hour to $0.97 an hour for work within a prison or jail.[55] Other estimates have found those incarcerated can earn between $0.33 cents and $1.41 per hour working for non-facility specific positions, for commercial companies.[56]
The vast majority of detainees have not engaged in non-immigration related crimes. According to the most recent data (as of April 4, 2026) from the Transactional Records Access Clearinghouse (TRAC) at Syracuse University, which monitors federal immigration data, 70% of current detainees have no criminal records and those with criminal records are often minor, including traffic violations.[57] In addition, in February 2026, just 2% of those immigrants that faced deportation proceedings initiated by the Department of Homeland Security (DHS) had non-immigration related criminal records.[58]
Minimum Wage & Minimal Justice
The federal minimum wage today is $7.25 per hour or $58 per day for an eight-hour shift.[59] A detained immigrant would need to work for 58 days to earn what a minimum wage worker earns in one day or more than one year to earn the $406 weekly paycheck of a minimum wage worker. In addition, minimum wage is as high as $17.95 per hour in Washington, D.C. and $17.13 per hour in Washington State. The map below shows the minimum wage rates in each state.[60]
Worker vs. Volunteer
Historically, U.S. courts have not considered immigrant detainees “workers” under the federal Fair Labor Standards Act of 1938.[61] However, more recent cases have found that detainees are due state minimum wage for work they perform in immigration detention centers. These cases are currently winding their way through the courts. Some of these cases have been appealed to the U.S. Supreme Court, some are in the discovery phase, and some cases are on their way to jury trials, which have not yet begun.
Many of the detainee lawsuits have claimed “unjust enrichment” on the part of the contractors running the detention facilities. Unjust enrichment is the “principle that a party cannot induce, accept, or encourage another to furnish or render something of value to such party and avoid payment for the value received,” according to Georgia State law.[62] Most legal definitions are similar. In the context of immigrant detainees, “unjust enrichment” suggests that the contractor at the facility that utilizes the services of immigrant detainees for just $1 per day obtained these services for an unjust amount of compensation. In addition, the 9th Circuit Court of Appeals found in January 2025 that there is nothing prohibiting GEO Group from paying detainees minimum wage and that their contract with ICE requires them to abide by both federal, state and local law, which would mandate paying minimum wage to immigrant detainees.[63]
Some of the ongoing lawsuits have also alleged forced labor, and even “slavery,” under the Trafficking Victims Protection Act (TVPA).[64] Dalila Yeend, a former immigrant detainee in the Buffalo Federal Detention Facility in New York, said this work and the pay “is bordering on slavery.”[65] One case was settled in 2023, another found that the TVPA did not apply to the Voluntary Work Program (VWP) detainees, and seven other cases in five states are ongoing.
A chart of the lawsuits regarding $1 a day wages to immigrant detainees can be found below.
Court Cases Challenging the $1 Per Day “Voluntary Work Program”
| FACILITY NAME | LOCATION | AVG. POPULATION | OPERATOR | LAWSUIT DETAILS | |
|---|---|---|---|---|---|
| Northwest ICE Processing Center (forerly Northwest Detention Center) | Tacoma, WA | 1,017 | GEO Group | Washington v. GEO Group & Nwauzor v. GEO Group | |
| The Washington Attorney General filed suit in 2017 against the GEO Group for violation of the state’s minimum wage law. In 2021 a federal jury awarded $17.3M to 10,000+ detainees and $5.9M to the state for “unjust enrichment” by GEO Group — a combined $23.2M judgment. In January 2025, the 9th Circuit Court of Appeals affirmed the case, and in August 2025 it denied a GEO Group request for a rehearing. On January 9, 2026, GEO Group filed its appeal or Petition for a Writ of Certiorari to the U.S. Supreme Court. | |||||
| Aurora Detention Facility | Aurora, CO | 1,000 | GEO Group | Menocal v. GEO Group | |
| A class action suit was filed in 2014 in the U.S. District Court for the District of Colorado under the Trafficking Victims Protection Act (TVPA) alleging forced labor and “unjust enrichment.” On February 25, 2026, the U.S. Supreme Court unanimously denied GEO Group’s request to dismiss the case based on the GEO Group’s argument that it had “sovereign immunity” in its role as a federal contractor. The case now proceeds to trial. This is the first TVPA forced labor case against an ICE contractor to reach the Supreme Court. A pretrial conference is set for June 3, 2026, and a final trial preparation conference is set for October 27, 2026. | |||||
| Adelanto ICE Processing Center | Adelanto, CA | 1,484 | GEO Group | Novoa v. GEO Group & Ramirez v. GEO Group | |
| Multiple class action suits were consolidated alleging minimum wage violations under California law and TVPA forced labor claims. The Novoa case was filed in 2017, and the Ramirez case was filed in 2018. The cases were stayed in the U.S. District Court for the Central District of California pending the outcome of the GEO Group’s appeal in the Washington State case. On January 9, 2026, GEO filed a Petition for Certiorari to the U.S. Supreme Court requesting they review the lower court’s decision. The 9th Circuit court case is stayed pending the disposition of GEO’s Petition for Certiorari to the U.S. Supreme Court. | |||||
| Mesa Verde ICE Processing Facility | Bakersfield, CA | 304 | GEO Group | Gomez v. GEO Group | |
| This case was filed in July 2022 in U.S. District Court for the Eastern District of California’s Fresno Division representing nine immigrants who were detained at both the Mesa Verde and Golden State Annex ICE facilities. Detainees allege unlawful wage theft, unjust enrichment, and forced labor. They allege they were forced to perform facility maintenance for $1/day or face disciplinary consequences, including loss of privileges. In 2022 and 2023 detainees held labor and hunger strikes protesting these conditions. Cases remain stayed pending GEO Group’s Washington State appeal which was filed with the U.S. Supreme Court on January 9, 2026. | |||||
| Golden State Annex | McFarland, CA | 529 | GEO Group | Gomez v. GEO Group | |
| This case was filed in 2022 in conjunction with the above case regarding the Mesa Verde ICE detention facility. As indicated above, the suit alleges forced labor and wage theft due to the $1/day payment to detainees for sanitation and maintenance work under the threat of retaliation, including solitary confinement, and loss of privileges if detainees refused to work. In addition, California’s Division of Occupational Safety and Health issued $100,000+ in citations against GEO Group following 2022 inspections, including a “willful” violation for failure to implement COVID-19 airborne disease protocols. The case remains stayed pending GEO Group’s Washington State appeal which was filed with the U.S. Supreme Court on January 9, 2026. | |||||
| Stewart Detention Center | Lumpkin, GA | 2,079 | CoreCivic | Barrientos v. CoreCivic | |
| Filed by the Southern Poverty Law Center in 2018 under the TVPA, alleging CoreCivic unjustly enriched itself and used coercion and threats of punishment, including solitary confinement and withholding access to basic necessities, to force detainees to work for $1/day cleaning the facility. The case was settled in October 2023. CoreCivic did not pay monetary damages but was required to post a formal ‘Declaration of Rights’ notifying detainees of their right to refuse to participate in the Voluntary Work Program. | |||||
| Otay Mesa Detention Center | San Diego, CA | 1,130 | CoreCivic | Owino v. CoreCivic | |
| Class action lawsuit filed in May 2017 in the U.S. District Court in the Southern District of California alleging CoreCivic’s VWP at Otay Mesa constituted forced labor under the TVPA and unjust enrichment under California law. In 2022, the 9th Circuit Court of Appeals ruled that the case could proceed as a class action, rejecting CoreCivic’s challenge to class certification. Discovery is ongoing. | |||||
| Cibola County Correctional Center | Milan, NM | 219 | CoreCivic | Ndambi v. CoreCivic | |
| In November 2018, several detainees filed a lawsuit in the U.S. District Court of Maryland in the Southern District alleging CoreCivic’s $1/day VWP violated the TVPA. The U.S. Court of Appeals for the 4th Circuit ruled adversely to the detainee in 2021, finding the TVPA did not apply to the VWP in this context — creating a circuit split with the 9th Circuit Court. The conflicting rulings increase the likelihood of a future Supreme Court ruling on these cases. (Although the detention facility is located in New Mexico, CoreCivic was organized as a Maryland corporation, which is where the lawsuit was filed.) | |||||
| Irwin County Detention Center | Ocilla, GA | 221 | LaSalle Corrections | Nilson Barahona, et. al., v. LaSalle Management Company, LLC, et. al. | |
| In March 2023, a lawsuit was filed in the U.S. District Court for the Middle District of Georgia against LaSalle by three immigrant detainees who had been held at the Irwin County Detention Center. The suit alleged the plaintiffs were forced to work for $1 per day and that refusal to work was met with threats of solitary conferment or lockdown in a detainee’s cell, threats of criminal prosecution for disobeying an officer’s order, downgrading a detainee’s housing, revoking access to the center’s commissary, and denying access to medical care. Discovery is now proceeding and is scheduled to be completed by April 16, 2027, with a tentative November 2027 trial date. | |||||
| Buffalo Federal Detention Facility | Batavia, NY | 678 | Akima Global Services, LLC | Yeend, et. al., v. Akima Global Services, LLC | |
| Plaintiffs filed this case in September 2020 in the New York State Supreme Court in Rensselaer County alleging unjust enrichment and incarcerated labor, stating that they were not paid fair wages for their time working at the Buffalo Federal Detention Facility operated by Akima Global Services LLC. The suit alleges that the detainees were given $1 a day in commissary credit for their labor, regardless of the number of hours they worked, and allege that this arrangement was “bordering on slavery.” The case was moved to the U.S. District Court for the Northern District of New York and remains active. No trial date has been set yet. | |||||
Profits & Politics
Regardless of the ultimate disposition of these lawsuits, immigration detention center contractors, particularly, GEO Group and CoreCivic, are benefitting financially from the Trump administration’s dramatic expansion of the detention camp complex. The Project on Government Oversight (POGO) released a report in February 2026 that looked at the top companies profitting from the Trump administration’s immigration crackdown.[77] The GEO Group was listed as number two (2) and CoreCivic was listed as number five (5).
According to POGO’s analysis, GEO Group received more than $710 million in ICE contracts from January 20, 2025, through January 19, 2026.[78] CoreCivic received nearly $269 million in ICE contracts during that same time-period. POGO’s investigation also found that the GEO Group, its’ executives and affiliated political action committees (PACs) made more than $1.6 million in donations to Trump-aligned PACs and Trump’s inauguration committee during the 2024 election cycle, while CoreCivic made more than $806,000 in similar donations. In addition, the GEO Group spent more than $3.6 million in lobbying expenditures last year, and CoreCivic spent slightly more, $3.7 million, in 2025 lobbying expenditures.[79]
The GEO Group has tried to influence the administration in other ways. Attorney General Pam Bondi lobbied, for instance, on behalf of the GEO Group in 2019 prior to her appointment as Attorney General in the Trump Administration while she was at Ballard Partners, LLC.[80]
The detention business has paid off well for companies such as GEO Group. Company co-founder George Zoley owns a 9-bedroom, 11-bathroom, 18,523 square foot home on more than 1-acre of land in Boca Raton, Florida, estimated to be worth more than $22.5 million.[81] The house is a “one-of-a-kind trophy estate” with “refined opulence,” according to Zillow. It includes an elevator, two laundry rooms, and a 4-bay garage, and 9 ½ to 23½ feet ceilings. Zillow describes the house this way:
“Embracing age-old ideals while artfully fashioned for today’s world, this expansive courtyard estate sprawls stately on a double lot along Royal Palm Yacht & Country Club’s championship golf course. Inspired by the majestic architecture and formal gardens of Miami’s landmark Vizcaya and other world acclaimed estates, this newly built compound was created under the direction of David Easton, an award-winning New York-based architect and interior designer lauded as one of America’s leading classicists and one of Architectural Digest’s AD 100 Designers.”[82]
Zoley’s home also includes iron gates, a statuesque formal great room, a series of terraces amid dramatic Italian formal gardens, a resort-style fountained pool with a mosaic-tiled spa under a garden pergola, a poolside cabana, and staff quarters, according to Zillow.
Palm Beach County property records indicate that the Boca Raton, Florida home is currently owned by Zoley.[83]
Conclusion
The disparity between Zoley’s wealth and the $1 per day pay to detained immigrants is striking. The tens of thousands of immigrants detained by the U.S. government deserve better than being paid $1 per day, and the federal contractors building an extensive network of detention camps across the country should not be making excessive profits at their expense.
Endnotes
[1] “ICE Detention Trends,” VERA INSTITUTE OF JUSTICE (Updated April 2, 2026), https://www.vera.org/ice-detention-trends

[2] Jonathon Booth, “Ending Forced Labor in ICE Detention Centers: A New Approach,” IMMIGRATION LAW JOURNAL, Georgetown University, (August 19, 2020), https://www.law.georgetown.edu/immigration-law-journal/wp-content/uploads/sites/19/2020/08/ENDING-FORCED-LABOR-IN-ICE-DETENTION-CENTERS-A-NEW-APPROACH.pdf

[3] Ibid.

[4] Lauren-Brooke Eisen, “Private Prison Companies’ Enormous Windfall: Who Stands to Gain as ICE Expands,” BRENNEN CENTER FOR JUSTICE (October 1, 2025), https://www.brennancenter.org/our-work/analysis-opinion/private-prison-companies-enormous-windfall-who-stands-gain-ice-expands

[5] “Nwauzor v. GEO Group Inc.,” UNITED STATES COURT OF APPEALS, NINTH CIRCUIT, United States Court of Appeals, Ninth Circuit, No. 21-36024, No. 21-36025 (January 16, 2025), https://caselaw.findlaw.com/court/us-9th-circuit/116874882.html

[6] Michelle Conlin and Kristina Cooke, “$11 toothpaste: Immigrants pay big for basics at private ICE lock-ups,” REUTERS (January 18, 2019), https://www.reuters.com/article/world/11-toothpaste-immigrants-pay-big-for-basics-at-private-ice-lock-ups-idUSKCN1PC0DJ/

[7] Letter: “Re: Retaliation Against Individuals in Immigration Detention at Mesa Verde Detention Facility and Golden State Annex,” from American Civil Liberties Union (ACLU) or Northern and Southern California, Freedom for Immigrants, Centro Legal de la Raza, California Collaborative for Immigrant Justice, and Innovation Law Lab to Department of Homeland Security, et. al. (September 12, 2022), https://lofgren.house.gov/sites/evo-subsites/lofgren.house.gov/files/9.12.22%20Mesa%20Verde%20-%20Golden%20State%20CRCL%20Complaint%20FINAL.pdf

[8] “Immigration Detention Statistics: A Retrospective and a Look Forward,” TRANSACTIONAL RECORDS ACCESS CLEARINGHOUSE (TRAC), Syracuse University (February 21, 2025), https://tracreports.org/reports/753/

[9] GEO Group, Inc., SALARY.COM, https://www.salary.com/tools/executive-compensation-calculator/geo-group-inc-executive-salaries?year=2025#google_vignette

[10] Ibid.

[11] “The Geo Group Reports Fourth Quarter and Full Year 2024 Results,” Press Release, THE GEO GROUP, INC. (February 27, 2025), https://www.sec.gov/Archives/edgar/data/923796/000119312525037537/d886579dex991.htm

[12] “The GEO Group Reports Fourth Quarter and Full Year 2025 Results,” NASDAQ (February 12, 2026), https://www.nasdaq.com/press-release/geo-group-reports-fourth-quarter-and-full-year-2025-results-2026-02-12

[13] Nick Schwellenbach, Luisa Clausen, and Aarushi Sahejpal, “ICE, Inc.: The Top Companies Profiting from Trump’s Immigration Crackdown,” PROJECT ON GOVERNMENT OVERSIGHT (POGO) (February 17, 2026), https://www.pogo.org/investigates/ice-inc-the-top-companies-profiting-from-trumps-immigration-crackdown

[14] CoreCivic, Inc., SALARY.COM, https://www.salary.com/research/executive-compensation/corecivic-inc-executive-salary

[15] Ibid.

[16] “CoreCivic Reports Fourth Quarter and Full Year 2024 Financial Results,” Press Release, CORECIVIC, INC., (February 10, 2025), https://www.sec.gov/Archives/edgar/data/1070985/000119312525023677/d518529dex991.htm

[17] “CoreCivic, Inc. SEC 10-K Report,” TRADINGVIEW (February 20, 2026), https://www.tradingview.com/news/tradingview:3fa0e7c2be8aa:0-corecivic-inc-sec-10-k-report/

[18] “The GEO Group Reports Fourth Quarter and Full Year 2025 Results,” NASDAQ (February 12, 2026), https://www.nasdaq.com/press-release/geo-group-reports-fourth-quarter-and-full-year-2025-results-2026-02-12

[19] “CoreCivic, Inc. SEC 10-K Report,” TRADINGVIEW (February 20, 2026), https://www.tradingview.com/news/tradingview:3fa0e7c2be8aa:0-corecivic-inc-sec-10-k-report/

[20] “8 USC 1555: Immigration Service expenses,” Office of the Law Revision Counsel, United States Code, U.S. HOUSE OF REPRESENTATIVES, https://uscode.house.gov/view.xhtml?req=granuleid:USC-prelim-title8-section1555&num=0&edition=prelim

[21] Fair Labor Standards Act of 1936, As Amended, U.S. HOUR AND WAGE DIVISION, Department of Labor, https://www.dol.gov/sites/dolgov/files/WHD/legacy/files/FairLaborStandAct.pdf

[22] “Supreme Court rules against private prison firm alleged to have forced immigrant detainees to work for $1 a day Politics,” PBS NEWS (February 25, 2026), https://www.pbs.org/newshour/politics/supreme-court-rules-against-private-prison-firm-alleged-to-have-forced-immigrant-detainees-to-work-for-1-a-day and Josh Gerstein, “Supreme Court deals setback to ICE detention contractor in fight over detainee work,” POLITICO (February 25, 2026), https://www.politico.com/news/2026/02/25/supreme-court-ruling-ice-detention-contractor-00797951

[23] Ugochukwu Nwauzor v. The GEO Group, Inc. (21-36024), Court of Appeals for the Ninth Circuit, COURT LISTENER, https://www.courtlistener.com/docket/65407093/ugochukwu-nwauzor-v-the-geo-group-inc/

[24] Letter: “Re: Retaliation Against Individuals in Immigration Detention at Mesa Verde Detention Facility and Golden State Annex,” from American Civil Liberties Union (ACLU) or Northern and Southern California, Freedom for Immigrants, Centro Legal de la Raza, California Collaborative for Immigrant Justice, and Innovation Law Lab to Department of Homeland Security, et. al. (September 12, 2022), https://lofgren.house.gov/sites/evo-subsites/lofgren.house.gov/files/9.12.22%20Mesa%20Verde%20-%20Golden%20State%20CRCL%20Complaint%20FINAL.pdf

[25] “U.S. Commission on Civil Rights Concerned with Alleged Abusive Labor Practices at Immigration Detention Centers,” Statement, U.S. COMMISSION ON CIVIL RIGHTS (December 21, 2017), https://www.usccr.gov/files/press/2017/12-21-PR.pdf

[26] “National Labor Relations Board Files Complaint Against GEO Group for Retaliation Against Workers at Mesa Verde Detention Facility,” CALIFORNIA COLLABORATIVE FOR IMMIGRANT JUSTICE (CCIJ) (January 9, 2025; Updated: January 14, 2025), https://www.ccijustice.org/post/nlrb-complaint-against-geo

[27] Stacy Maiers, “President Trump ousts NLRB board member, general counsel,” NATIONAL EDUCATION ASSOCIATION (January 28, 2025), https://www.nea.org/about-nea/media-center/press-releases/president-trump-ousts-nlrb-board-member-general-counsel

[28] Josh Eidelson, “US Labor Board Drops Case Over Prison Company’s Treatment of Detained Immigrants,” BLOOMBERG (March 19, 2025), (as retrieved on yahoo!news) https://www.yahoo.com/news/us-labor-board-drops-case-223012134.html

[29] Michelle Conlin and Kristina Cooke, “$11 toothpaste: Immigrants pay big for basics at private ICE lock-ups,” REUTERS (January 18, 2019), https://www.reuters.com/article/world/11-toothpaste-immigrants-pay-big-for-basics-at-private-ice-lock-ups-idUSKCN1PC0DJ/

[30] “Nwauzor v. GEO Group Inc.,” UNITED STATES COURT OF APPEALS, NINTH CIRCUIT, United States Court of Appeals, Ninth Circuit, No. 21-36024, No. 21-36025 (January 16, 2025), https://caselaw.findlaw.com/court/us-9th-circuit/116874882.html

[31] See: “Nwauzor v. GEO Group Inc.,” UNITED STATES COURT OF APPEALS, NINTH CIRCUIT, United States Court of Appeals, Ninth Circuit, No. 21-36024, No. 21-36025 (January 16, 2025), https://caselaw.findlaw.com/court/us-9th-circuit/116874882.html and Jonathon Booth, “Ending Forced Labor in ICE Detention Centers: A New Approach,” IMMIGRATION LAW JOURNAL, Georgetown University, (August 19, 2020), https://www.law.georgetown.edu/immigration-law-journal/wp-content/uploads/sites/19/2020/08/ENDING-FORCED-LABOR-IN-ICE-DETENTION-CENTERS-A-NEW-APPROACH.pdf

[32] Michelle Conlin and Kristina Cooke, “$11 toothpaste: Immigrants pay big for basics at private ICE lock-ups,” REUTERS (January 18, 2019), https://www.reuters.com/article/world/11-toothpaste-immigrants-pay-big-for-basics-at-private-ice-lock-ups-idUSKCN1PC0DJ/

[33] Ibid.

[34] Ibid.

[35] Ibid.

[36] See: “Nwauzor v. GEO Group Inc.,” UNITED STATES COURT OF APPEALS, NINTH CIRCUIT, United States Court of Appeals, Ninth Circuit, No. 21-36024, No. 21-36025 (January 16, 2025), https://caselaw.findlaw.com/court/us-9th-circuit/116874882.html and McKenzie Funk, “An ICE Contractor Is Worth Billions. It’s Still Fighting to Pay Detainees as Little as $1 a Day to Work,” PROPUBLICA (March 19, 2025) https://www.propublica.org/article/geo-group-ice-detainees-wage

[37] “Nwauzor v. GEO Group Inc.,” UNITED STATES COURT OF APPEALS, NINTH CIRCUIT, United States Court of Appeals, Ninth Circuit, No. 21-36024, No. 21-36025 (January 16, 2025), https://caselaw.findlaw.com/court/us-9th-circuit/116874882.html

[38] Ibid.

[39] Results of an Unannounced Inspection of Northwest ICE Processing Center in Tacoma, Washington,” OFFICE OF INSPECTOR GENERAL, Department of Homeland Security, OIG-23-26 (May 22, 2023), https://www.oig.dhs.gov/sites/default/files/assets/2023-05/OIG-23-26-May23.pdf

[40] “Results of an Unannounced Inspection of ICE’s Caroline Detention Facility in Bowling Green, Virginia,” Department of Homeland Security, OFFICE OF INSPECTOR GENERAL, OIG-23-51 (September 15, 2023), https://www.oig.dhs.gov/sites/default/files/assets/2023-09/OIG-23-51-Sep23.pdf

[41] Ibid.

[42] Sharon Yoo, “Washington wins court fight to inspect Tacoma ICE detention center but inspectors still blocked from entry,” KING5 NEWS (April 9, 2026), https://www.king5.com/article/news/community/facing-race/washington-immigration/tacoma-ice-detention-center-inspectors-blocked/281-79899ede-2b33-494a-bd05-3addcf7bbda1

[43] “Inspection: 1609228.015 - The Geo Group, Inc. Dba Golden State Annex,” OCCUPATIONAL SAFETY & HEALTH ADMINISTRATION (OSHA) (June 15, 2022), https://www.osha.gov/ords/imis/establishment.inspection_detail?id=1609228.015

[44]  Ibid.

[45] “Justice-Free Zones: U.S. Immigration Detention Under the Trump Administration,” AMERICAN CIVIL LIBERTIES UNION (ACLU), May 2022, https://immigrantjustice.org/wp-content/uploads/2025/05/Justice-Free-Zones_Immigrant_Detention_Report_ACLU-HRW-NIJC_April-2020.pdf

[46] Ibid.

[47] Jonathon Booth, “Ending Forced Labor in ICE Detention Centers: A New Approach,” IMMIGRATION LAW JOURNAL, Georgetown University, (August 19, 2020), https://www.law.georgetown.edu/immigration-law-journal/wp-content/uploads/sites/19/2020/08/ENDING-FORCED-LABOR-IN-ICE-DETENTION-CENTERS-A-NEW-APPROACH.pdf

[48] Letter: “Re: Retaliation Against Individuals in Immigration Detention at Mesa Verde Detention Facility and Golden State Annex,” from American Civil Liberties Union (ACLU) or Northern and Southern California, Freedom for Immigrants, Centro Legal de la Raza, California Collaborative for Immigrant Justice, and Innovation Law Lab to Department of Homeland Security, et. al. (September 12, 2022), https://lofgren.house.gov/sites/evo-subsites/lofgren.house.gov/files/9.12.22%20Mesa%20Verde%20-%20Golden%20State%20CRCL%20Complaint%20FINAL.pdf

[49] Ibid.

[50] “National Labor Relations Board Files Complaint Against GEO Group for Retaliation Against Workers at Mesa Verde Detention Facility,” CALIFORNIA COLLABORATIVE FOR IMMIGRANT JUSTICE (CCIJ) (January 9, 2025; Updated: January 14, 2025), https://www.ccijustice.org/post/nlrb-complaint-against-geo

[51] Ibid.

[52]  Stacy Maiers, “President Trump ousts NLRB board member, general counsel,” NATIONAL EDUCATION ASSOCIATION (January 28, 2025), https://www.nea.org/about-nea/media-center/press-releases/president-trump-ousts-nlrb-board-member-general-counsel

[53] Josh Eidelson, “US Labor Board Drops Case Over Prison Company’s Treatment of Detained Immigrants,” BLOOMBERG (March 19, 2025), (as retrieved on yahoo!news) https://www.yahoo.com/news/us-labor-board-drops-case-223012134.html

[54] “Dirty Dozen: Dangerous and Reckless Employers Risking the Lives of Workers and Communities,” NATIONAL COUNCIL FOR OCCUPATIONAL SAFETY AND HEALTH (NATIONAL COSH) (2025), https://nationalcosh.org/dd25

[55] Matthew Saleh, Timothy McNutt and Alex Herazy, “Subminimum Wages in New York State Prisons,”
Center for Applied Research on Work (CAROW), CORNELL UNIVERSITY, (May 14, 2024), https://www.ilr.cornell.edu/carow/carow-policy/subminimum-wages-new-york-state-prisons

[56] Wendy Sawyer, “How much do incarcerated people earn in each state?” PRISON POLICY INSTITUTE (April 10, 2017), https://www.prisonpolicy.org/blog/2017/04/10/wages/#:~:text=Incarcerated%20people%20assigned%20to%20work,the%20institutions%20that%20confine%20them.

[57] “Immigration Detention Quick Facts,” TRANSACTIONAL RECORDS ACCESS CLEARINGHOUSE (TRAC), Syracuse University (April 4, 2026), https://tracreports.org/immigration/quickfacts/detention.html#detention_nocrim

[58] “Just 2% of Immigration Court Filings Based on Alleged Criminal Activity in February 2026,” TRANSACTIONAL RECORDS ACCESS CLEARINGHOUSE, Syracuse University (April 7, 2026), https://tracreports.org/reports/771/

[59] “State Minimum Wage Laws,” Wage and Hour Division, U.S. DEPARTMENT OF LABOR, https://www.dol.gov/agencies/whd/minimum-wage/state

[60] Ibid.

[61] Fair Labor Standards Act of 1936, As Amended, U.S. HOUR AND WAGE DIVISION, Department of Labor, https://www.dol.gov/sites/dolgov/files/WHD/legacy/files/FairLaborStandAct.pdf

[62] Nilson Barahona, et. al., v. LaSalle Management Company, et. al., ORDER, U.S. DISTRICT COURT FOR THE MIDDLE DISTRICT OF GEORGIA, VALDOSTA DIVISION, (March 31, 2025), https://www.govinfo.gov/content/pkg/USCOURTS-gamd-7_23-cv-00024/pdf/USCOURTS-gamd-7_23-cv-00024-5.pdf

[63] “Nwauzor v. GEO Group Inc.,” UNITED STATES COURT OF APPEALS, NINTH CIRCUIT, United States Court of Appeals, Ninth Circuit, No. 21-36024, No. 21-36025 (January 16, 2025), https://caselaw.findlaw.com/court/us-9th-circuit/116874882.html

[64] Human Trafficking: Key Legislation, U.S. DEPARTMENT OF JUSTICE, https://www.justice.gov/humantrafficking/key-legislation

[65] Massarah Mikati, “‘Borders on slavery’: Suit claims labor violations at Batavia immigration facility,” OLEAN TIMES HERALD (September 4, 2020), https://www.oleantimesherald.com/2020/09/04/borders-on-slavery-suit-claims-labor-violations-at-batavia-immigration-facility/

[66] “ICE Detention Trends,” VERA INSTITUTE OF JUSTICE (Updated April 2, 2026), https://www.vera.org/ice-detention-trends

[67] Ugochukwu Nwauzor v. The GEO Group, Inc. (21-36024), Court of Appeals for the Ninth Circuit, COURT LISTENER, https://www.courtlistener.com/docket/65407093/ugochukwu-nwauzor-v-the-geo-group-inc/

[68] Menocal v. The GEO Group, Inc. (1:14-cv-02887), U.S. District Court for the District of Colorado, COURT LISTENER, https://www.courtlistener.com/docket/4196461/menocal-v-the-geo-group-inc/

[69] Raul Novoa v. The GEO Group, Inc. (5:17-cv-02514), U.S. District Court for the Central District of California, COURT LISTENER, https://www.courtlistener.com/docket/6244853/raul-novoa-v-the-geo-group-inc/

[70] Hernandez Gomez v. The GEO Group, Inc. (1:22-cv-00868), U.S. District Court for the Eastern District of California, COURT LISTENER, https://www.courtlistener.com/docket/63593326/hernandez-gomez-v-the-geo-group-inc/

[71] Ibid.

[72] Barrientos v. CoreCivic, Inc. (4:18-cv-00070), U.S. District Court for the Middle District of Georgia, COURT LISTENER, https://www.courtlistener.com/docket/6384840/barrientos-v-corecivic-inc/

[73] Owino v. CoreCivic, Inc. (3:17-cv-01112), U.S. District Court for the Southern District of California, COURT LISTENER, https://www.courtlistener.com/docket/6127721/owino-v-corecivic-inc/

[74] Ndambi v. CoreCivic, Inc. (1:18-cv-03521), U.S. District Court for the District of Maryland, COURT LISTENER, https://www.courtlistener.com/docket/8218504/ndambi-v-corecivic-inc/

[75] Barahona, et. al. v. LaSalle Management Company, LLC et al., U.S. District Court for the Middle District of Georgia, JUSTIA, https://dockets.justia.com/docket/georgia/gamdce/7:2023cv00024/128616

[76] Yeend v. Akima Global Services, LLC (25-1061), U.S. Court of Appeals for the Second Circuit Court, COURT LISTENER, https://www.courtlistener.com/docket/71868270/yeend-v-akima-global-services-llc/

[77] Nick Schwellenbach, Luisa Clausen, and Aarushi Sahejpal, “ICE, Inc.: The Top Companies Profiting from Trump’s Immigration Crackdown,” PROJECT ON GOVERNMENT OVERSIGHT (POGO) (February 17, 2026), https://www.pogo.org/investigates/ice-inc-the-top-companies-profiting-from-trumps-immigration-crackdown

[78] Ibid.

[79] Ibid.

[80] Jon Golinger, “Conflicted Justice: U.S. Attorney General-Nominee Pam Bondi's Problematic Corporate Lobbying Clients,” PUBLIC CITIZEN (January 8, 2025), https://www.citizen.org/article/conflicted-justice/

[81] Zillow.com, https://www.zillow.com/homedetails/1515-Fan-Palm-Rd-Boca-Raton-FL-33432/46724402_zpid/

[82] Ibid.

[83] Property Detail, George Zoley, PALM BEACH COUNTY PROPERTY APPRAISER, https://pbcpao.gov/Property/Summary?parcelId=06434729100170160
Stay Updated on Public Citizen
Follow Public Citizen
Support Our Work
Statement for the Record: The President’s 2026 Trade Policy Agenda
May 6, 2026
The Honorable Jason Smith
Chairman
U.S. House Committee on Ways and Means
Washington, DC 20515
The Honorable Richard Neal
Ranking Member
U.S. House Committee on Ways and Means
Washington, DC 20515
Re: Statement for the Record – The President’s 2026 Trade Policy Agenda
Dear Chairman Smith and Ranking Member Neal:
Public Citizen, a nonprofit consumer advocacy organization with more than one million members and supporters, welcomes the opportunity to submit this statement for the record to the Ways and Means Committee hearing on the President’s 2026 Trade Policy Agenda.
For many years, U.S. trade policy rewarded companies for moving production to countries with lower wages, weaker labor protections, and weaker environmental rules. Those policies helped drive factory closures, diminish workers’ bargaining power, and increase inequality, while also contributing to environmental harm and migration pressures abroad. President Trump rose to power in part by promising to fix these problems.
The president’s trade agenda, released on March 2, 2026, makes several bold claims, focusing on the need to rebuild American industry. While in itself a laudable goal, the lack of substance in the policy indicates that this administration lacks a coherent plan to achieve any of its stated aims, including re-shoring manufacturing or advancing the interests of American workers. Additionally, Ambassador Jamieson Greer’s testimony before this Committee on April 22, 2026, cherry-picked facts to present an incomplete and false picture of the Trump administration’s disastrous trade policy. For example:
- The administration has refused to acknowledge the 80,000 manufacturing jobs lost during Trump’s second term. Instead, Ambassador Greer pointed to a single quarter’s data (Q1 2026) to argue that Trump has “now reversed the trend of manufacturing job losses.” This ignores the thousands of Americans pushed out of work in Trump’s second term to date.[i]
- Ambassador Greer claimed “our agricultural community is one of the largest beneficiaries” of America First policies, yet in 2025, global agricultural exports fell by $4.8 billion, some 6% from the previous year, and 23% less than in 2022.[ii] Soybean exports — the backbone of many farm economies — were among the hardest hit, falling over 30% in 2025, a decline directly related to a retaliatory trade war with China.[iii]
- Ambassador Greer claimed that real manufacturing worker pay has increased by $2,400 in one year under President Trump. This statement is not supported by facts. Greer misquoted his own press release, incorrectly attributing figures from the mining sector, not manufacturing. The most recent Real Earnings release from the Bureau of Labor Statistics shows real average hourly earnings for all workers fell 0.6 percent in the last year (March 2025-March 2026) and production workers in manufacturing saw virtually no change in that time.[iv]
Simply put, working people are not benefiting from the administration’s chaotic approach to trade. Tariffs can be a useful tool when targeted to support critical industries, defend against unfair trade practices, and when linked to a broader plan to support domestic production and workers. However, this administration’s policy focuses on sweeping, unstrategic tariff threats, secretive pressure campaigns against other countries, and trade demands that place the interests of the biggest corporations over that of the public.
-
Agreements on Reciprocal Trade
The 2026 Trade Policy Agenda identifies the Agreements on Reciprocal Trade (ART) as the centerpiece of this administration’s trade strategy. In his opening statement, Ambassador Greer boasted about concluding nine ARTs together with nine framework deals. However, the ARTs were based on illegally imposed tariffs, making it unsurprising that countries have already called into question the legality of these deals, which may not survive the test of time.
In addition, the terms of these deals make it clear that they constitute comprehensive and legally binding trade agreements. Yet, the deals were negotiated in complete secrecy, outside any formal delegation of congressional authority and without public participation. The USTR failed to publish negotiating drafts, undertake stakeholder consultations, or produce analyses of the elements and terms of the deals.
The unacceptable process under which the ARTs have been and continue to be negotiated is matched by concerning substantive rules. Several provisions in the ARTs target crucial public interest policies in the signatory countries that have been inappropriately labeled as “non-tariff barriers” in the administration’s 2025 and 2026 National Trade Estimate reports. These reports largely regurgitate a list of public-interest laws from around the globe that big corporations want removed, ranging from crucial digital economy regulations to climate and public health policies. The USTR must recognize that countries have a sovereign right to adopt measures in furtherance of public purposes, as done in the Biden administration’s NTE Report of 2024.
-
An Agenda for Big Tech
Trump’s Trade Agenda, the provisions of ART texts to date, and the 2026 NTE Report make it clear that this administration will continue to target crucial digital economy regulations of foreign countries on behalf of Big Tech companies. We note, in particular, that the administration has sought to target:
- Data protection and privacy regulations that seek to limit the ability of corporations to export data without implementing adequate privacy safeguards;[v]
- Digital competition regulations that seek to promote a level playing field in the digital ecosystem and protect consumers from unethical practices of dominant enterprises;[vi]
- AI regulations, like those in the EU, which impose safety and accountability obligations to AI systems, as well as regulatory measures to enhance transparency of AI systems by allowing regulators to access source code and algorithms prior to market access;[vii]
- Digital taxation measures that seek to ensure Big Tech companies pay their fair share;
- Online safety regulations that seek to prevent the spread of illegal content such as election misinformation, non-consensual intimate images, online violence, and hate speech;
- Regulations that seek to protect traditional industries or local culture, such as Australia’s regulations requiring Big Tech companies to compensate news producers for reusing their content, or local content and language norms for online streaming services, as seen in Canada and Europe.
Targeting foreign digital regulations makes consumers of digital services the world over less safe, reduces the ability for smaller enterprises to compete in the digital economy, and concentrates power in the hands of Big Tech companies.
We caution the administration against conflating the profitability of Big Tech companies with the overall health of the U.S. economy or citizens’ economic well-being. Actions such as opposing foreign taxation of Big Tech companies, opposing regulatory action against anti-competitive and anti-privacy practices of Big Tech companies and so on, may appear to benefit the U.S. by boosting profits of Big Tech, but will ultimately reduce trust in U.S. technology companies and spur the development of local alternatives.
In addition, pursuing a deregulatory agenda abroad also harms U.S. consumers and small businesses. The last few years have seen increased debate over domestic regulation of technology in the U.S., particularly as the known and potential harms of digital platforms, AI systems, and unregulated data flows have become more apparent. Several domestic laws and policies — aimed at promoting a level playing field in the digital ecosystem, protecting user data, ensuring the safety of children online, and protecting vulnerable communities against harms caused by AI systems — are similar to the foreign laws targeted by the ARTs. It is, therefore, short-sighted and a clear abandonment of the national interest to attack the types of robust digital governance measures that should be adopted domestically.
Further, extreme free flow of data clauses in trade agreements are inconsistent with congressional and state-level actions to protect Americans’ data.[viii] Similarly, domestic online safety laws as well as AI regulations — including those imposing transparency and accountability requirements on AI companies in fields such as insurance, employment, and healthcare, or laws that seek to protect the public from harm caused by chatbots, intimate deepfakes, and election deepfakes — could be threatened by broadly worded anti-discrimination, source code secrecy, platform immunity and other provisions in digital trade chapters of trade agreements.
Rather than seeking to deregulate the digital ecosystem through undemocratic and unaccountable trade processes, digital trade chapters in trade agreements should, if included at all, focus solely on issues concerning the digitization of trade (e.g., improving customs facilitation). Trade negotiations are not a suitable venue for making binding decisions on how to regulate various aspects of the digital ecosystem, particularly when this could have significant implications on the ability of Congress or states to regulate risks posed by emerging technologies, and ensure a safer and more competitive digital economy.
Digital chapters in trade agreements should also include labor-related provisions that reduce dependence on forced or other forms of coercive labor in technology supply chains and do away with laws that enable technology companies to escape domestic liability for violations of labor, environmental, and other public interest laws.
-
An Agenda for Big Pharma
A clear objective of this administration’s trade policy agenda, though not explicitly mentioned in the report, is to return the U.S. to a maximalist approach to intellectual property protections, even at the expense of public health. The use of ARTs and reciprocal tariffs to target foreign countries’ pharmaceutical pricing practices is a blatant attempt to push Big Pharma’s profit maximization agenda.[ix] Forcing other countries to pay more for medicines will not result in lower prices in the United States.[x] Americans pay high prices due to monopolistic pricing and weak domestic controls.
Instead of attacking policies that we ourselves should be emulating, the administration should take steps to maintain the availability and access to medicines by supporting stronger, more diversified supply chains, including through targeted approaches to bolster domestic capacity.
-
USMCA and North American Trade
The 2026 trade agenda states that the ongoing review of the U.S.-Mexico-Canada Free Trade Agreement (USMCA) is a priority. Yet information provided to date provides no assurances that the administration will secure the serious, substantive improvements needed to fix the agreement to support working people across North America.
Public Citizen has joined nearly 700 civil society organizations in calling for the following changes to the USMCA:
- The Rapid Response Mechanism (RRM) must be significantly strengthened and broadened to encompass all sectors of the economy, including agriculture.
- Environmental rules must be enforceable in real time and with meaningful penalties. Environmental enforcement should include facility-specific tools modeled on the labor Rapid Response Mechanism to end social dumping or incentivize offshoring to avoid domestic safeguards.
- Rules of origin and related provisions should be strictly revised to enhance real production in North America rather than allowing third countries backdoor access.
- The agreement’s extreme digital trade rules should be revised or removed, as they limit Congress’s and states’ power to regulate large technology firms and protect consumers. Congress should reject rules that lock in Big Tech-friendly provisions concerning cross-border transfers of data, source code secrecy, broad platform liability protections, or that undermine antitrust or domestic taxation policies.
- The USMCA’s intellectual property (IP) provisions that require patent term extensions, market exclusivity, patent linkage, and TRIPS-plus enforcement mechanisms should be removed to improve access to affordable, lifesaving medicines. The USMCA should affirm governments’ right to use compulsory licensing to address public health needs and to negotiate lower prescription medicine prices.
- Certain Investor State Dispute Settlement (ISDS) provisions remain in the USMCA and should be fully removed.[xi] While the USMCA made significant progress by eliminating ISDS between the U.S. and Canada and restricting its application between the U.S. and Mexico, ISDS rights are preserved for companies with covered government contracts in Mexico in certain sectors.
-
Critical Minerals Trade
As the United States seeks to build out a critical minerals supply chain, Congress should reject any trade agenda that treats resource-rich countries merely as a raw-materials store for U.S. industry.
Recent administration efforts, such as in the so-called “strategic partnership agreement” with the Democratic Republic of Congo, prioritize investor access and geopolitical advantage.[xii] Similarly, the ART with Indonesia commits Indonesia to remove key industrial policy tools that allow for value addition in its minerals supply chain, to facilitate U.S. coal imports, and to purchase $15 billion in fossil fuels.[xiii]
Both instances follow a similar pattern: the United States bullies a country to sign onto an ART that allows U.S. corporate interests to access and control mineral wealth, without implementing enforceable labor and environmental safeguards, or acknowledging indigenous rights. Thus, workers, communities, and producing countries bear the social and environmental costs while profits are exported to the U.S.
Congress should not accept a critical minerals policy built on secrecy, coercion, and corporate privilege. Any minerals agreement should be subject to full congressional review and approval, shaped through meaningful public participation, and conditioned on binding labor, environmental, human, and indigenous rights standards backed by strong enforcement mechanisms.
-
Climate and the Environment
The America First Trade Policy wholly ignores “climate change” in the 2025 and 2026 agendas, even as other nations accept reality and advance forward-thinking measures such as the EU’s Carbon Border Adjustment Mechanism. Such policies address genuine cross-border risks, and U.S. trade policy should adopt and defend the space for such public-interest rules.
Despite some lip service to environmental protection in the ARTs, these agreements lock in a fossil fuel infrastructure that hastens climate harm.[xiv] The 2026 NTE report also attacks a host of climate-friendly policies the world over, including:
- Policies to boost the clean energy transition, such as the EU’s Carbon Border Adjustment Mechanism (CBAM), the Renewable Energy Directive, the Deforestation-Free Supply Chain Regulation, the Eco Design for Sustainable Products Regulation, and the Sustainable Aviation Fuel Regulation
- Green certification and local content policies, such as the UAE’s green certification program and India’s domestic content requirements for renewable energy government procurement contracts.
- Policies to tackle plastic pollution, including Canada’s Zero Plastic Waste Agenda; United Arab Emirates ban on some single-use styrofoam products; Dominican Republic’s regulations prohibiting import of non-biodegradable straws and cutlery; Oman’s regulation on single-use plastic bags; and Cote d’Ivoire’s regulations on import of plastic bags.
Policies that aim to preserve biodiversity, prevent pollution, and protect the environment should not be attacked as trade barriers. To this end, we urge the administration not just to support the adoption of a Climate Peace Clause — a binding commitment by governments to refrain from using dispute settlement mechanisms in the WTO or other trade and investment agreements to challenge each other’s climate policies — but to implement such terms in its domestic trade policies, including future NTE reports.
-
The Path Forward
The United States still lacks a strong industrial policy to rebuild domestic production and reduce dangerous supply chain weaknesses. Contrary to the Trump administration’s claims, a worker-centered trade policy cannot and should not rest on tariffs alone. A truly modern industrial strategy would commit to building durable new productive capacity, creating stable and resilient high-road supply chains, and implement the public investment, procurement rules, sector strategies, and worker protections needed to sustain industrial revival over time. In fact, the Trump administration has moved in the opposite direction by systematically dismantling the Inflation Reduction Act and public investment, including in critical scientific research.[xv]
Resilient domestic production requires targeted investment, stronger labor and environmental standards, diversified sourcing, and trade rules that support domestic capacity rather than simply reacting to trade imbalances after the fact. By contrast, this administration’s trade agenda remains legally precarious, democratically deficient, and economically punishing for American families.
The administration’s refusal to provide justification memos, rationale, or otherwise act with transparency further undermines its claims that the current tariff strategy is a serious step towards rebuilding American industry. We note, for instance, that the administration (both the White House and Office of the U.S. Trade Representative) has failed to release the full “Report to the President on the America First Trade Policy,” despite the public interest in disclosure of the reasons behind the implementation of “reciprocal tariffs” by this administration in April 2025. A Freedom of Information Act request seeking disclosure of this crucial report has also been left unanswered. Congress must demand full transparency into the administration’s tariff strategy, particularly given multiple reports indicating the possibility of insider trading, preferential exemptions, and other unethical practices.
Congress should reclaim its Article 1 Constitutional trade authority and hold the Trump administration accountable for its illegal tariffs and the secretive deals with other countries. All ARTs must be submitted for congressional approval.
Congress should also conduct oversight to ensure that investigations conducted by the USTR (including under Section 301) are not used as a political tool.[xvi] The misuse of these powers threatens the legitimacy of genuine investigations conducted by the USTR and could invite unwanted reciprocal action by foreign countries.
Meaningful Congressional oversight should extend to:
- terminating President Trump’s emergency tariffs;
- mandating full transparency in ART, critical minerals agreements, and other negotiations;
- scrutinizing the tariff refund processes, to prevent mismanagement and abuse; and
- investigating the administration’s tariff setting processes as well as the rationale for providing various exemptions. To date, the USTR and Trump have provided no clear guidance on tariff exemptions, their process, criteria, or oversight. Numerous reports indicate that certain companies, or their products, received tariff exemptions following political contributions, lobbying, and personal outreach with the Trump administration.[xvii]
The question before Congress in 2026 is not whether to go back to the old trade model or simply accept Trump’s shifting tariff policy. Trade policy should support industrial rebuilding, protect governments’ power to regulate in the public interest, center enforceable labor and environmental standards, reject new giveaways for Big Tech and Big Pharma, dismantle corporate courts, and improve transparency. U.S. trade policy should defend the space for those public-interest rules, not trade them away.
To that end, Congress must reject President Trump’s 2026 trade agenda. The country needs a worker-centered trade policy tied to industrial strategy, strong enforcement, public health, climate responsibility, fair competition, and democratic control over the rules that shape the economy.
[i] Adding insult to injury, those displaced workers no longer have access to federal retraining safety nets like the Trade Adjustment Assistance program, which Congress has failed to reauthorize since 2022.
[ii] Info accessible from International Trade Administration, U.S. Exports by Partner for NAICS code 111 – Agricultural Products in 2025.
[iii] Info accessible from International Trade Administration, U.S. Exports by Partner for HS code 1201: Soybeans.
[iv] Average Hourly Earnings of Production and Nonsupervisory Employees, Manufacturing
[v] The 2026 NTE report lists 27 jurisdictions allegedly imposing unfair restrictions on cross-border data transfers. A majority of the laws being targeted are data protection or privacy regulations that seek to ensure personal data is protected from unethical commercial exploitation.
[vi] The 2026 NTE report targets antitrust regulation in 10 jurisdictions, with the ARTs including sweeping “anti-discrimination” provisions that could be used against diverse digital economy regulations on the false basis that such laws or regulatory actions target or discriminate against U.S. entities.
[vii] The 2026 NTE Report lists the EU’s AI Act as a trade barrier (similar to last year) and also includes AI-related policies from five other jurisdictions as trade barriers, largely to oppose attempts to develop local AI ecosystems.
[viii] At the federal level, the U.S. restricts foreign data transfers under the Protecting Americans’ Data from Foreign Adversaries Act of 2024, Cybersecurity requirements for U.S Cloud Computing Contractors, and Executive Order 14117 – Preventing Access to Americans’ Bulk Sensitive Personal Data, and United States Government Related Data by Countries of Concern. At the state level, cross-border data transfers are restricted by laws such as Montana’s Genetic Information Privacy Act, and the 2023 Amendment to California’s Confidentiality of Medical Information Act. Refer Rethink Trade, The Digital Trade Data Heist, February 2025.
[ix] For example, the Trade Policy Agenda TPA states that Argentina committed to an ART that would “address long-standing intellectual property (IP) issues identified in previous Special 301 Reports … to repeal restrictive patentability criteria.” Patentability criteria are exactly the policy tools that governments use to prevent pharmaceutical evergreening and preserve access to affordable generics.
[x] See for example, the U.S.-UK Pharmaceutical Pricing Arrangement, which commits the UK to raising its spending on prescription drugs, an outrageous giveaway to Big Pharma, while doing nothing to lower prices in the U.S.
[xi] This mechanism has empowered foreign investors to sue governments in secretive, private arbitration panels, undermining democratic governance and critical public-interest regulation.
[xii] The DRC deal, for example, gives U.S. firms preferential access to mineral assets and a right of first offer over select mining sites while bullying its way into Congolese mineral governance by establishing a Joint Steering Committee stocked with U.S. Cabinet and IDFC representatives. U.S. State Department, Strategic Partnership Agreement Between the Government of the United States of America and the Government of the Democratic Republic of the Congo
[xiii] Indonesia also made significant concessions across digital policy, agriculture, health standards, and critical minerals, in exchange for a 19% “reciprocal” tariff rate. The White House, Trump Administration Finalizes Trade Deal with Indonesia, February 19, 2026
[xiv] For example, the ART with Indonesia requires the country to facilitate the importation of U.S. coal, including highly polluting metallurgical coal, and to purchase $15 billion in Liquefied Petroleum Gas and other fossil fuels. Agreement Between The United States Of America And The Republic Of Indonesia On Reciprocal Trade
[xv] In fact, it should be a matter of serious concern that China has surpassed the U.S. in research spending.
[xvi] For example, President Trump announced 50% punitive tariffs on Brazil via a social media post on July 9, 2025 in an attempt to interfere in Brazil’s domestic judicial processes on behalf of his long-time friend and ally, Jair Bolsonaro, while also seeking to help out his Big Tech buddies including Elon Musk, who were facing regulatory action in Brazil. Public Citizen, Written Testimony of Public Citizen to the U.S. Trade Representative Hearing on its Section 301 Investigation of Acts, Policies, and Practices of Brazil, September 2, 2025
[xvii] For example, the CBP reduced enforcement, rescinding a Withhold Release Order, following million-dollar donations to Trump-aligned committees. In another eyebrow raising example, the U.S. lowered tariffs on Swiss imports from 39% to 15% after Swiss billionaires gifted Trump a Rolex desk clock and a gold bar engraved with the numbers 45 and 47 valued at $130,000. New York Times, https://www.nytimes.com/2025/03/19/business/economy/trump-sugar-forced-labor-ban-lifted.html; The Guardian, Swiss gold and Rolex gifts to Trump arouse ‘disgust’ in Europe, November 21, 2025
You might be interested in
Stay Updated on Public Citizen
Follow Public Citizen
Support Our Work
Senate: Stop Trump’s Crypto Grift
Senate Banking Committee considers digital market legislation
The Honorable Tim Scott, Chair
The Honorable Elizabeth Warren, Ranking Member
Honorable Members
U.S. Senate Banking Committee
Washington, D.C. 20510
Re: Ethics Requirements in Digital Asset Market Structure Legislation
Dear Chair, Ranking Member, and Members of the Committee,
On behalf of more than one million members and supporters of Public Citizen, we ask the Senate Banking Committee to establish strict ethics guardrails in digital market legislation. This must include prohibitions on federally elected officials, including the president, from engaging in any cryptocurrency venture. President Trump’s expansive ventures into crypto already violate several existing laws. Approving a bill that fails to confront these violations would explicitly declare that lawmakers countenance such infractions.
Specifically, we ask that any bill must include the following:
• Ban any form of crypto issuance, ownership, sponsorship, promotion, endorsement, and/or profiteering by a federally elected official, including the president and any family members.
• Require divestiture from any existing crypto venture. All proceeds must be disgorged and deposited in the U.S. Treasury or returned to investors.
• Establish civil and/or criminal monetary penalties for future infractions that must be two times the value of profits. The Attorney General shall bring a civil action against an individual in violation of these bans.
• Penalize crypto quid-pro-quo. Any federally elected official, including the president, who, directly or indirectly, corruptly demands, seeks, receives, accepts, or agrees to receive or accept anything of value personally, including crypto-related transactions, in return for the performance of any official act, shall be fined for at least two times the monetary equivalent of the thing of value, whichever is greater, or imprisoned for not more than five years, or both.
Trump’s crypto abuses include violations of anti-bribery statues, conflicts-of-interest laws, along with acts prohibited by the U.S. Constitution. Promotion of his meme coin constitutes a solicitation of a gift, which is a violation of 18 U.S.C. § 201. Trump pardoned a confessed money launderer after that individual transferred millions of dollars to one of the president’s crypto ventures. The president may neither solicit nor receive a bribe under 18 U.S.C. § 201. Trump accepted hundreds of millions of dollars from more than one foreign government for his crypto ventures, including his meme coin venture and a stablecoin. Four days before Trump took office, an entity controlled by the national security adviser of the United Arab Emirates purchased a 49% stake in a fledgling Trump crypto venture, putting $187 million into the coffers of the Trump family. The Constitution’s emoluments clause (Article 1, Section 9) prohibits acceptance of anything of value from a foreign government. These count as only a few of Trump’s illegal corruptions. Public Citizen recently documented Trump’s byzantine conflicts involving Binance, the world’s largest crypto exchange, which admitted to ignoring anti-money-laundering laws in 2023. Binance, however, has continued to help Iranian crypto traders skirt sanctions, according to recent media reports. Yet, at the same time Trump exposes American soldiers to the perils of war in Iran, his crypto venture is looking to increase its relationship with Binance.
By his own disclaimers, Trump’s crypto ventures do not fall within his official acts as president, and therein do not enjoy immunity provided by a Supreme Court decision.
An independent Attorney General (AG) would assign a special counsel to examine Trump’s corruption, paving the way for a post-presidential prosecution. This Department of Justice does not operate independent of Trump’s bidding. A clear-eyed Congress would impeach and convict Trump for these massive infractions. The current congressional majority remains blindered.
But responsible members of this committee cannot abdicate their obligation to prohibit this or any president from illegal profiteering as it considers any legislation.
Recently, the Senate unanimously approved a ban on its members participating in bets on prediction markets. Sen. Bernie Moreno (R-Ohio), the principal sponsor, explained, “United States senators have no business engaging in speculative activities like prediction markets while collecting a taxpayer-funded paycheck, period.”
Such laudable standards must also apply to the president and his crypto abuses.
For questions, please contact Bartlett Naylor at bnaylor@citizen.org.
Sincerely,
Public Citizen
Stay Updated on Public Citizen
Follow Public Citizen
Support Our Work
Public Citizen Testimony to the Texas House State Affairs Committee Regarding Microgrids and Distributed Energy Resources
To: The Honorable Ken King, Chair, House Committee on State Affairs; The Honorable Ana Hernandez, Vice-Chair, House Committee on State Affairs; Members, House Committee on State Affairs
From: Kaiba White, Public Citizen’s Texas office, kwhite@citizen.org
Microgrids and Distributed Energy Resources
Public Citizen appreciated the opportunity to provide information and policy recommendations relevant to the deployment of distributed energy resources
Distributed energy resources offer unique opportunity to provide kilowatt-hours to the electric grid, alleviate transmission needs, and improve grid and community resilience. Distributed energy resources can be deployed more quickly than utility scale resources or transmission infrastructure and thus offer an opportunity to avoid more costly transmission projects. Yet, even as Texas has excelled at deploying utility-scale resources, distributed energy resource deployment lags far behind. Key policy changes could unlock distributed energy potential in Texas.
Fair Compensation for Distributed Energy Resources
Utilities across Texas systematically discourage the use of distributed energy resources by establishing rate policies that dramatically undervalue energy provided to the grid. Texas has never had a statewide net metering or other distributed energy resource compensation policy beyond an ill-defined requirement to pay avoided cost. Thus, utilities have had broad latitude to assign avoided cost values with little or no analysis to support the validity of those values.
In 2024, Public Citizen released a study of rates and fees specific to residential customers with customer-sited distributed energy generation at all non-competitive Texas electric utilities to inform policymakers.[1] This scope included all 141 municipal and cooperative electric utilities in Texas, and monopoly investor-owned electric utilities that serve Texas customers outside of ERCOT. This research complemented an assessment by Solar United Neighbors (SUN) of distributed energy compensation policies offered by retail electric providers that serve customers in ERCOT’s competitive markets. We found that only 28 of the utilities offered net metering or a distributed generation rate that was comparable. The average avoided cost rate paid for energy sent to the grid from distributed energy systems was 43% of the retail rate charged for consumption from the grid. The avoided cost rates ranged down to just 17% of the retail rate. In the two years since we released this study, we have continued to track distributed generation compensation policies and have seen additional degradation of the value provided to customers through rates. Some utilities that offered net metering when we first did this research have now replaced those policies with lower avoided cost rates.
These low distributed energy compensation rates play a significant role in slowing the deployment of these resources by lengthening the pay-back time for these resources. A customer’s energy usage patterns determine how sensitive they are to low compensation rates. Customers who are able to self-consume the energy they produce when it is produced are insulated from low compensation rates. They are, however, impacted by additional monthly fees and other discriminatory charges that at least 35 of the utilities levy on customers with distributed energy resources. Customers who self-consume less of the energy they produce at the moment it is produced – which is often the case for those who work outside of the home during the day – are significantly impacted by low compensation rates. Rate policies at some utilities are so unfavorable that a customer who exports 50 percent of the energy produced from their distributed solar energy system wouldn’t pay back their investment for longer than 25 years (which is the typical warranty for sola panels). This is a clear discouragement to investing in distributed energy resources.
Not only are the distributed energy tariffs low, but the values assigned are often based on faulty assumptions and little or no expert analysis. Electric cooperatives and municipally owned electric utilities are often able to get rate changes approved by their boards of directors without substantial analysis or customer engagement. Avoided cost is frequently defined as the average cost of wholesale electricity for the utility. The monopoly vertically integrated utilities that must get rates approved by the Public Utility Commission of Texas (PUCT) aren’t held to a higher standard either.
For example, the PUCT recently overturned a recommendation from an administrative law judge (ALJ) in the El Paso Electric rate case and approved a discriminatory demand charge for residential customers with distributed energy resources. The ALJ recommended against this demand charge because El Paso Electric provided little evidence to support inaccurate assumptions about the costs and benefits of distributed energy generation to the utility. Also, demand charges are common for commercial customers, but are generally viewed as inappropriate for residential customers, who are less sophisticated and may have less ability to adjust demand patterns – especially for those who are at home during the day, including many retirees and parents with small children.
The situation in the competitive markets isn’t any better. There used to be several retail electric providers (REPs) that provided rate packages that included full net metering. That changed several years ago and there are now no full net metering options available in the competitive market. It is our understanding that this is in large part because of the REPs are charged by the transmission and distribution utilities (TDUs) in a way that doesn’t accurately value the avoided costs provided by distributed generation. This is a problem that could be remedied by the PUCT, but hasn’t been.
Instead of haphazardly guessing at the value of distributed energy resources, utilities should be required to conduct a thorough analysis of the costs and benefits, based on real data. The National Standard Practice Manual (NSPM) for Benefit-Cost Analysis of Distributed Energy Resources[2] provides a framework to do just that. The NSPM was developed by leading experts on distributed energy resource valuation and has been utilized in assessing the value of distributed energy resources in over a dozen jurisdictions. Factors that the NSPM framework identifies that apply to utilities and the grid include:
- Generation benefits: avoided costs of energy generation, capacity, environmental compliance, and ancillary services and reduced market prices
- Transmission benefits: conserving transmission capacity and avoiding transmission system losses.
- Distribution system benefits: conserving distribution system capacity, avoiding distribution system losses, reducing distribution system operations and maintenance costs, and maintaining distribution system voltage.
- Other benefits, including improved reliability and resilience, reduced risks, and reduced bad debt and disconnections.
In 2024, the Texas Solar Energy Society commissioned a study of the value of distributed solar energy to the ERCOT grid.[3] The study was conducted utilizing the NSPM and included an analysis of values to the ERCOT grid and some additional societal benefits. The study revealed that the generation, transmission, and distribution values provided by distributed solar energy resources total 15¢ per kilowatt-hour. Even though this calculation doesn’t account for the full avoided transmission costs that a utility can realize with distributed energy resources, it is more than triple what many Texas utilities are offering their customers for energy provided to the grid from distributed energy resources.
The Texas Legislature should pass legislation to establish a clear and comprehensive minimum standard for all Texas utilities to use when calculating compensation or avoided cost rates for energy exported to the grid from distributed energy resources, while allowing utilities to go beyond the minimum standard if they wish. A version of the methodology should be established for the TDUs as well. We recommend that the NSPM framework be the reference for these minimum standards.
Plug-In Solar
Plug-in solar systems typically range from 200 to 1,600 watts. They can plug into a wall outlet and don’t require professional installation. They are in widespread use in Germany and other parts of Europe, where there are several million systems in use.
Pug-in solar offers significant opportunity to expand access to distributed solar for residents who live in multifamily properties, are renters, or simply cannot afford to purchase a larger permanent solar installation for their homes. These small systems can yield several hundred dollars in annual savings on an electric bill and can also be paired with batteries to provide resilient back-up power for select appliances.
The states of Utah and Maine have passed laws setting standards for plug-in solar systems and establishing residents’ right to use compliant systems. Another 32 states, including Oklahoma, Wyoming and Idaho are considering legislation to enable the use of plug-in solar. The Texas Legislature should pass legislation to allow Texans to access these affordable and effective distributed energy systems.
Public Citizen welcomes the opportunity to work with members of the committee to advance these policy recommendations.
Stay Updated on Public Citizen
Follow Public Citizen
Support Our Work
Colombia obtiene fallo favorable en el Tribunal Andino por la licencia obligatoria del dolutegravir — pero la batalla jurídica interna continúa
GHP Corp, Medicinas para la Gente Latinoamérica, Acción International para la Salud (AIS Peru), Public Citizen
El Tribunal de Justicia de la Comunidad Andina declaró infundada la demanda de dos farmacéuticas multinacionales contra la licencia obligatoria del medicamento de primera línea para el VIH, en una decisión histórica para el acceso a medicamentos en la región. Sin embargo, siguen pendientes tres procesos judiciales ante tribunales colombianos.
Bogotá, Colombia — En una decisión de trascendencia regional, el Tribunal de Justicia de la Comunidad Andina falló a favor de Colombia el 27 de abril de 2026, declarando infundada la demanda presentada por las compañías ViiV Healthcare y Shionogi & Co., que alegaban un incumplimiento por parte del país ante la declaratoria de interés público del medicamento dolutegravir.
El fallo establece precedentes claros y concretos para la región latinoamericana:
- Las flexibilidades del ADPIC son defendibles. Los gobiernos que usen licencias obligatorias para proteger la salud pública cuentan ahora con un respaldo jurisprudencial supranacional sólido frente a posibles litigios de la industria farmacéutica.
- Los derechos de patente tienen límites frente a la salud pública. El fallo confirma que ninguna patente es absoluta cuando está en juego el acceso a tratamientos esenciales para poblaciones vulnerables.
- El uso gubernamental no comercial es una modalidad válida. La licencia colombiana fue otorgada exclusivamente para uso del Estado, lo que el Tribunal validó como una herramienta proporcionada y legítima.
- La temporalidad de una licencia debe estar condicionada a la realidad epidemiológica. No es necesario fijar una fecha rígida si las razones de salud pública persisten — una interpretación que abre espacio para políticas de salud más flexibles y adaptadas a contextos cambiantes.
El Tribunal concluyó que Colombia no incumplió la Normativa Andina ni las obligaciones derivadas de la Comunidad Andina, al considerar que la licencia obligatoria se ajustó a las reglas vigentes. Señaló además que el país había incorporado tanto las condiciones como los límites de vigencia de la medida, incluyendo un plazo determinado, y que los argumentos de las farmacéuticas no desvirtuaban la legalidad del proceso.
Una licencia obligatoria, el origen de la disputa
Una licencia obligatoria permite a un gobierno autorizar la producción o importación de versiones genéricas de un medicamento patentado, sin el consentimiento del titular de la patente, por razones de interés público. Esta herramienta está reconocida en el derecho internacional y forma parte de las flexibilidades del Acuerdo sobre los Aspectos de los Derechos de Propiedad Intelectual relacionados con el Comercio (ADPIC) de la Organización Mundial del Comercio. Su uso permite reducir significativamente los costos de los medicamentos y ampliar el acceso a las poblaciones que más los necesitan.
En octubre de 2023, el gobierno colombiano inició el proceso de declaratoria de interés público sobre el dolutegravir, un fármaco de primera línea para el tratamiento del VIH, recomendado por la Organización Mundial de la Salud por su eficacia y menor tasa de efectos secundarios. Esta medida permite al Estado autorizar la compra o producción de versiones genéricas sin exclusividad del titular, reduciendo así los costos del medicamento.
En abril de 2024, la Superintendencia de Industria y Comercio otorgó la primera licencia obligatoria sobre el medicamento, y en junio ratificó esa medida al resolver los recursos presentados por ViiV Healthcare y Shionogi & Co., confirmando que el Estado puede autorizar la producción o importación de versiones genéricas aun cuando existe una patente vigente. Posteriormente se llevó a cabo el proceso de implementación de dicha licencia.
Antes de llegar al Tribunal, la Secretaría General de la Comunidad Andina ya había emitido en octubre de 2024 el Dictamen N° 004-2024, concluyendo que Colombia no había violado la normativa andina. Las farmacéuticas insistieron y escalaron el caso ante el Tribunal de Justicia de la Comunidad Andina en enero de 2025, cuestionando la legalidad de la licencia. Entre sus argumentos señalaron que la medida no definía con claridad su duración, que se otorgó sin criterios suficientes de temporalidad y que desdibujaba el carácter excepcional de este tipo de licencias.
Colombia argumentó que la licencia obligatoria se ajusta a la normativa andina y que su duración puede depender de las condiciones que dieron origen a la declaratoria de interés público, sosteniendo que se trata de una herramienta legítima de salud orientada a garantizar el acceso a tratamientos esenciales.
La batalla jurídica interna continúa:
No obstante la relevancia de este fallo, es importante precisar que la victoria ante el Tribunal Andino no cierra el expediente jurídico en su totalidad, siguen activos tres procesos judiciales ante tribunales colombianos:
- En el Consejo de Estado, bajo el radicado 11001032400020240006100, cursa una demanda de nulidad contra las resoluciones No. 1579 del 2 de octubre de 2023 y No. 2024 de 2023 expedidas por el Ministerio de Salud y Protección Social. El proceso se encuentra en el despacho
- En el Tribunal Administrativo de Bogotá, radicado 25000234100020240123400, cursa una demanda de nulidad y restablecimiento del derecho contra esas mismas resoluciones ministeriales. El proceso también se encuentra en el despacho.
- Un tercer proceso, radicado 250002341000202500159 00, cuestiona ante el Tribunal Administrativo de Bogotá las resoluciones No. 20049 del 23 de abril de 2024 y No. 34716 de 2024, emanadas de la Superintendencia de Industria y Comercio. En los tres procesos, diversas organizaciones de la sociedad civil, entre ellas PMA LAC y GHP Corp., intervienen como coadyuvantes en la defensa de la licencia.
Las actuaciones judiciales actualmente en trámite representan una oportunidad para que las autoridades nacionales continúen consolidando el marco institucional que respalda esta política pública. La decisión que se adopte contribuirá a fortalecer la seguridad jurídica, la coherencia entre instancias y la confianza en los mecanismos previstos por el ordenamiento jurídico.
Una resolución oportuna permitirá reafirmar el compromiso del Estado con la protección del derecho a la salud y con la implementación responsable de las herramientas disponibles en el derecho internacional para promover el acceso equitativo a medicamentos esenciales.
Si bien la patente del principio activo dolutegravir relacionada con la licencia obligatoria acaba de expirar (abril 28 de 2026), en otros países de la región y en Colombia continúan vigentes otras patentes relacionadas con este medicamento, particularmente en combinaciones terapéuticas utilizadas en los programas de VIH. Por tanto, este asunto no se cierra con el vencimiento de la patente base. El precedente fijado por el Tribunal Andino es relevante y debe servir como guía para Colombia y para otros países de la región al momento de evaluar el uso de las flexibilidades del ADPIC cuando persistan barreras derivadas de derechos exclusivos. La decisión reafirma que, ante tensiones entre intereses comerciales y la protección de la salud pública, los Estados conservan la facultad —y la responsabilidad— de priorizar el acceso oportuno y asequible a medicamentos esenciales.
You might be interested in
Stay Updated on Public Citizen
Follow Public Citizen
Support Our Work
Colombia wins favorable ruling at the Andean Tribunal on the dolutegravir compulsory license — but the domestic legal battle continues
GHP Corp, Medicinas para la Gente Latinoamérica, Acción International para la Salud (AIS Peru), Public Citizen
The Andean Community Court of Justice dismissed as unfounded the complaint filed by two multinational pharmaceutical companies against the compulsory license for the first-line HIV medication, in a historic decision for access to medicines in the region. However, three legal proceedings before Colombian courts remain pending.
Bogotá D.C., Colombia — In a decision of regional significance, the Andean Community Court of Justice ruled in favor of Colombia on April 27, 2026, dismissing as unfounded the complaint filed by ViiV Healthcare and Shionogi & Co., which alleged that Colombia had violated its obligations under the public interest declaration for dolutegravir.
The ruling sets clear and concrete precedents for the Latin American Region:
- TRIPS flexibilities are defensible. Governments that use compulsory licenses to protect public health now have solid supranational jurisprudential backing against potential litigation by the pharmaceutical industry.
- Patent rights have limits when public health is at stake. The ruling confirms that no patent is absolute when access to essential treatments for vulnerable populations is at stake.
- Non-commercial government use is a valid modality. The Colombian license was granted exclusively for State use, which the Court validated as a proportionate and legitimate tool.
- The duration of a license must be conditioned on epidemiological reality. It is not necessary to set a rigid end date if the public health reasons persist — an interpretation that opens space for more flexible health policies adapted to changing contexts.
The Court concluded that Colombia did not breach Andean regulations or its obligations under the Andean Community, finding that the compulsory license was consistent with applicable rules. It further noted that Colombia had incorporated both the conditions and the duration limits of the measure, including a defined term, and that the pharmaceutical companies’ arguments did not undermine the legality of the process.
A compulsory license: the origin of the dispute
A compulsory license allows a government to authorize the production or importation of generic versions of a patented medicine, without the consent of the patent holder, for reasons of public interest. This tool is recognized under international law and forms part of the flexibilities of the Agreement on Trade-Related Aspects of Intellectual Property Rights (TRIPS) of the World Trade Organization. Its use can significantly reduce drug costs and expand access for the populations that need them most.
In October 2023, the Colombian government initiated the process of public interest declaration for dolutegravir, a first-line HIV treatment drug recommended by the World Health Organization for its efficacy and lower rate of side effects. This measure allows the State to authorize the purchase or production of generic versions without the patent holder’s exclusivity, thereby reducing the cost of the medication.
In April 2024, the Superintendency of Industry and Commerce granted the first compulsory license for the medication, and in June confirmed that measure when resolving the challenges filed by ViiV Healthcare and Shionogi & Co., affirming that the State may authorize the production or importation of generic versions even where a patent is in force. The implementation process of the license subsequently took place.
Prior to reaching the Court, the General Secretariat of the Andean Community had already issued in October 2024 Dictamen N° 004-2024, concluding that Colombia had not violated Andean regulations. The pharmaceutical companies persisted and escalated the case before the Andean Community Court of Justice in January 2025, challenging the legality of the license. Among their arguments, they contended that the measure did not clearly define its duration, that it was granted without sufficient temporal criteria, and that it blurred the exceptional nature of such licenses.
Colombia argued that the compulsory license complies with Andean regulations and that its duration may depend on the conditions that gave rise to the public interest declaration, maintaining that it is a legitimate health tool aimed at ensuring access to essential treatments.
The domestic legal battle continues:
Notwithstanding the significance of this ruling, it is important to note that the victory before the Andean Tribunal does not fully close the legal docket — three judicial proceedings before Colombian courts remain active:
- Before the Council of State, under case number 11001032400020240006100, there is a nullity action against Resolutions No. 1579 of October 2, 2023 and No. 2024 of 2023 issued by the Ministry of Health and Social Protection. The case is currently pending before the chamber.
- Before the Administrative Court of Bogotá, case number 25000234100020240123400, a nullity and rights-restoration action has been filed against those same ministerial resolutions. This case is also pending before the chamber.
- A third proceeding, case number 250002341000202500159 00, challenges before the Administrative Court of Bogotá Resolutions No. 20049 of April 23, 2024 and No. 34716 of 2024, issued by the Superintendency of Industry and Commerce. In all three cases, several civil society organizations — including PMA LAC and GHP Corp. — are participating as intervening parties in defense of the license.
The ongoing judicial proceedings represent an opportunity for national authorities to continue strengthening the institutional framework that underpins this public policy. Whatever decision is reached will contribute to reinforcing legal certainty, coherence across branches of government, and confidence in the mechanisms provided by the legal order.
A timely resolution will allow the State to reaffirm its commitment to protecting the right to health and to the responsible use of tools available under international law to promote equitable access to essential medicines.
Although the patent on the active ingredient dolutegravir related to the compulsory license has just expired (April 28, 2026), other patents related to this medication remain in force in Colombia and in other countries in the region, particularly in therapeutic combinations used in HIV programs. Therefore, this matter is not closed by the expiration of the base patent. The precedent set by the Andean Tribunal is relevant and should serve as a guide for Colombia and for other countries in the region when evaluating the use of TRIPS flexibilities where barriers arising from exclusive rights persist. The decision reaffirms that, when tensions arise between commercial interests and the protection of public health, States retain the authority — and the responsibility — to prioritize timely and affordable access to essential medicines.
You might be interested in
Stay Updated on Public Citizen
Follow Public Citizen
Support Our Work
Comments on the Maryland PDAB Draft Proposed Regulations on an Upper Payment Limit for Ozempic
Maryland is working to support affordability through its Prescription Drug Affordability Board (PDAB). On April 22, 2026, the PDAB released draft proposed regulations for an Upper Payment Limit for Ozempic.
Ozempic (semaglutide) is manufactured by Novo Nordisk and approved by the FDA to help control blood sugar levels, reduce the risk of cardiovascular disease, and reduce the risk of worsening kidney disease in patients with type 2 diabetes.
The pharmaceutical industry often fights efforts to rein in prescription drug costs by claiming that attempts to make drugs more affordable will harm the ability to invest in research and development for new medicines. In reality, pharmaceutical companies do not set prices based on a drug’s research and development cost. Rather, insulated from competition by monopoly protections, companies set prices based on what the market will bear and reap large profits in the process.
Novo Nordisk’s pricing and revenues for Ozempic cannot be explained by research and development (R&D) spending. The company has made over $69.5 billion in sales revenue from Ozempic since the drug’s launch in 2018. These revenues are an order of magnitude higher than even the most generous estimates of research and development costs that take into account failed candidates and a reasonable return on investment. Since Novo Nordisk launched Ozempic, the company has spent over $56.3 billion on share repurchases and shareholder dividends—1.7 times as much as it spent on R&D across its entire portfolio ($32.6 billion).[1]
Novo Nordisk sells the same drug at much lower prices in comparable countries and still makes a profit at those prices. Based on net price estimates, Ozempic is as much as five times as expensive in the U.S as in peer countries. Meanwhile, researchers estimate that the drug could be profitably manufactured for as little as around $3 for a monthly supply.
Novo Nordisk’s patenting tactics could stave off generic competition — a proven way to lower prices — keeping prices higher for longer. Follow-on patents for semaglutide, many of which cover minor modifications, provide patent protections until 2042, ten years after the patent covering the drug substance expires.
We encourage the PDAB to act to reduce Ozempic costs and ensure Novo Nordisk cannot put profits over the needs of everyday Americans.
[1] Public Citizen analysis of company financial reports 2018–2025.