Climate Change – rising global temperatures vs weather
 We have been posting a lot about climate change impacts on our facebook page the past several months and when I read articles about a climate action plan goal of keeping global temperature rise to 1.5 or 2 degrees Celsius, I realize that that means very little to me intuitively (and not just because I am American and think of temperature in Fahrenheit), because I cannot translate that to my day to day life. However, living here in Central Texas, I can relate to what a 100 degree temperature high is like.
Last week a co-worker forwarded a link to a New York Times page “How Much Hotter Is Your Hometown Than When You Were Born?” that lets you put in your hometown (or any location) and the year you were born, and it shows you the number of days over 90 degrees when you were born, today and by the end of this century. Obviously, here in Central Texas, 100 is the benchmark by which we deem a day as really hot, and over the Labor Day weekend, Austin, Texas had logged 52 days of 100+ degree highs making it the 5th most in the area since our weather record keeping began. One of the local weather stations also reported that this has been the 3rd hottest summer in Austin, falling below the years of 2009 and 2011.
Over the past several weeks, as I heard more and more people expressing their intolerance for the relentless heat, I started to think about my 40 years of summers here in Central Texas. My recollection was that there used to be summers with fewer days at 100 degrees when I first moved here. Rather than depend upon my intuitive statistics, I decided to look at historical highs for the past 40 years, and they in fact bore out my initial thesis that we were experiencing more high heat days since 1978. Now I should point out that the City of Austin has grown from a population of 331,900 in 1978 to 950,715 in 2017 along with commensurate development, creating a heat island, but even areas that have not had explosive population growth such as Clovis, NM, when I plug that into the NY Times site it still showed increasing numbers of hot weather days. That said, I decided to look at recorded high temperatures over 100 degrees Fahrenheit during the months of May through September from 1978 through 2018 in Austin, TX. This is what I found.
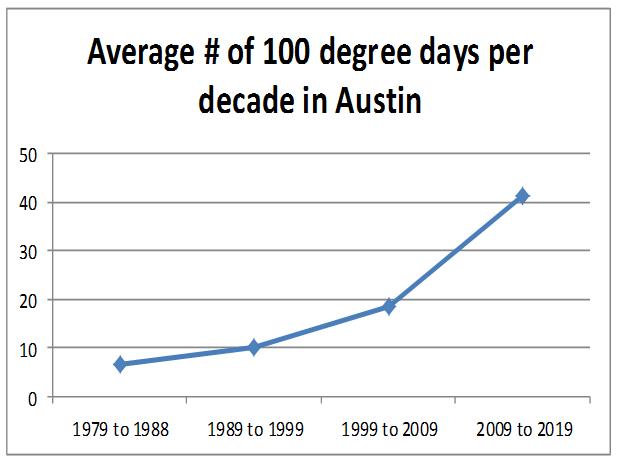
- Between 1979 and 1988 we averaged 6.5 days of 100+ degree days per year.
- Between 1989 and 1998 we averaged 10.1 days of 100+ degree days per year.
- Between 1999 and 2008 we averaged 18.7 days of 100+ degree days per year.
- Between 2009 and 2018 we averaged 41.3 days of 100+ degree days per year.
Keep in mind we had 90 100 degree days in 2011, screaming past the previous record of 62 days, and perhaps skewing the average for this past decade, but even if we corrected for that the data is daunting, especially since Texas climate scientists are telling us that 2011 could become our new norm.
 As you can see, yearly we can see weather patterns, but over time you can see the number of 100 degree days trending upward.
Again looking at this information graphed out, really drove home the trends of increasingly hot years, confirming my personal perceptions which I recognize can be biased based on other things going on in my life from year to year, such as having my air conditioning unit go out during a heat wave and having to endure the heat without AC for a couple of days before a service company could get to me because they were overwhelmed. Or my conviction that 1987 was unendurable even though we had no 100 degree days that summer, but rather because I was in my 3rd trimester during the height of a central Texas summer, had gained 40 pounds and the volume of blood in my body had increased by a whopping 50 percent.
So if you have a spare couple of days and want to actually look at high temperatures over time, you can do you own research using Weather Underground‘s actual recorded temperatures by day in your area.