Thirty-one years of Pharmaceutical Industry Criminal and Civil Penalties: 1991-2021
Opioid settlements have surged in recent years, but the number and size of federal and state enforcement actions remain low
By Michael T. Abrams, M.P.H., Ph.D. and Sidney M. Wolfe, M.D.*
Acknowledgements
Many thanks to Nina Zeldes, Ph.D., Fiona Lynn, M.P.S. for reviewing various aspects of this report. Special thanks for inspiration and guidance from Sammy Almashat, M.D., M.P.H., who was the lead author of our previous reports on this topic, and Michael Carome, M.D., the previous Director of the Health Research Group.
Robert Steinbrook, M.D., is the Director of Public Citizen’s Health Research Group.
This report is dedicated to Sidney Wolfe, M.D. who died on January 1, 2024. Dr. Wolfe made essential contributions to this report and our previous reports on this topic. His vision, passion, and integrity inspire our work every day.
About Public Citizen
Public Citizen is a national non-profit organization with more than 500,000 members and supporters. We represent consumer interests through lobbying, litigation, administrative advocacy, research, and public education on a broad range of issues including consumer rights in the marketplace, product safety, financial regulation, worker safety, safe and affordable health care, campaign finance reform and government ethics, fair trade, climate change, and corporate and government accountability.
Through its Health Research Group, Public Citizen engages in research and advocacy to promote evidence-based, system-wide changes in health care policy, with a focus on improving drug, device and other medical technology safety and effectiveness, and transparency and accountability in oversight actions related to such interventions.
Contact Public Citizen
| Main Office | Capitol Hill | Texas Office |
| 1600 20th Street NW | 215 Pennsylvania Avenue SE, #3 | 309 E 11th Street, Suite 2 |
| Washington, D.C. 20009 | Washington, D.C. 20003 | Austin, Texas 78701 |
| Phone: 202-588-1000 | Phone: 202-546-4996 | Phone: 512 477-1155 |
For more information, please visit www.citizen.org.
Executive Summary
Background
Public Citizen has published four previous reports — in 2010,[1] 2012,[2] 2016,[3] and 2018[4] — documenting the number and size of criminal and civil settlements and court judgments reached between the U.S. federal and state[5] governments and pharmaceutical manufacturers. The 2018 report included all settlements from 1991-2017. The current report focuses on settlements announced in 2018 to 2021 and includes data from 1991-2021.
Methods
Like the 2018 report, this report includes all settlements, regardless of the size of the financial penalty. For the period prior to July 19, 2012, our reports include only settlements of $1 million or greater. Beginning with the 2016 report, we have included all settlements. In this and all previous reports, the dollar amounts stated are nominal (as stated at the time of the settlement announcement) and summarized by year of the settlement announcements (rather than by the year of the anticipated or actual payment). Present value calculations are not made to discount dollars promised or paid in future years.
Results
From 1991-2021, the federal and state governments entered into 482 settlements with pharmaceutical manufacturers, totaling $62.3 billion in financial penalties. From 2018-2021, they entered into 70 settlements, totaling $23.7 billion. The number of settlements from 2018-2021, the four years added by this report, was lower than the number of settlements from 2014-2017 (77 settlements) but substantially higher for the financial amount recovered ($5.8 billion). The 2018-2021 period (particularly 2020-2021) were the years during which the highest monetary settlements against the pharmaceutical industry have thus far been achieved. Of the $20.1 billion in financial settlements in 2020-2021, $16.3 billion (81%) was related to opioids.
The 2010-2013 period remains as the four-year interval with the highest number of individual settlements (203 settlements). Figure 1 shows the number of settlements by year, and Figure 2 shows the financial amounts by year. For the 2018-2021 period, 2018 was a notably low year for both the number of settlements (8) and the total financial amount ($440 million).
Other key findings include the following:
- From 2018-2021, there were 44 federal settlements totaling $14.7 billion. The average settlement amount was $335 million. There were 26 state settlements totaling $9.0 billion, with an average settlement amount of $346 million. Compared with 2014-2017 (29 state settlements, $506 million total amount, $17 million average settlement), state financial settlement amounts markedly increased, primarily because of opioid settlements in 2021. Federal financial settlement amounts peaked in 2020 because of opioid settlements.
- From 2018-2021, there were two multistate settlements, both involving opioids, one in 2020 for $1.6 billion and one in 2021 for $5 billion.
- Single-state settlements spiked in 2019 (11 total settlements) and 2021 (seven total settlements). These totals were markedly less than those observed from 2010-2013 (more than 22 settlements in each of these years).
- From 1991-2017, all criminal penalties were the result of federal action. Although there were notable peaks in criminal financial penalties between 2009-2013, the amounts dropped to nearly zero from 2013-2017. From 2018-2021, the amounts of criminal financial settlements continued to be far less than the amounts of civil settlements in the same year. The exception was 2020, when there was a $5.5-billion multistate criminal settlement with Purdue Pharma about opioids.
- From 1991-2021, the most common violation was overcharging government health programs (mainly drug-pricing fraud against state Medicaid programs). Since 2013, the number of settlements for drug-pricing fraud against state Medicaid programs has decreased. Unlawful promotion charges yielded the most settlement dollars ($22.3 billion of $62.3 billion in settlements, 36%).
- From 1991-2021, whistleblower (qui tam) complaints, brought mostly under the federal False Claims Act, were responsible, at least in part, for 112 of 214 (52%) federal settlements and $29.3 billion of $49.5 billion (59%) in federal penalties. A much lower proportion of state settlements (18 of 268; 7%) and state financial penalties ($857 million of $12 billion; 7%) originated from whistleblower actions. The state and federal qui tam patterns observed in 2018-2021 were generally consistent with those for prior years except for two large state opioid settlements that were not qui tam cases (Mallinckrodt for $1.6 billion in 2020 and Johnson & Johnson for $5 billion in 2021). In 2020, the $8.3 billion Purdue opioid settlement dominated the federal financial amounts.
- From 1991-2021, 34 (three more than observed through 2017) states reached at least one single-state settlement with a pharmaceutical company. Based largely on a single $834 million judgment awarded to Hawaii in 2021 for the unlawful promotion of the cardiovascular medicine clopidogrel (PLAVIX),[6] Hawaii recovered the most money as a proportion (160%) of its Medicaid drug expenditures. Although Oklahoma recovered just 9% of its Medicaid drug expenditures from pharmaceutical settlements, it had the second-highest proportion of recoveries. Louisiana had the most single-state settlements (55). From 1991-2021, 15 (one less than observed through 2017) of the 34 states with at least one single-state settlement had a return on investment of $1 or greater per enforcement dollar spent. These 15 states recouped enough money through financial penalties from such pharmaceutical settlements alone to offset their entire (pharmaceutical and non-pharmaceutical) Medicaid fraud enforcement budgets from fiscal years 2006-2021.
- From 1991-2021, Purdue, Johnson & Johnson, GlaxoSmithKline, and Pfizer accrued more in financial penalties— $8.9 billion, $8.4 billion, $7.9 billion, and $4.7 billion, respectively, to federal and state governments¾ than any other companies. In rank order by amount: Novartis, Teva, Abbott, Merck, Bristol Myers Squibb, Mallinckrodt, Eli Lilly, Reckitt Benckiser, Schering-Plough, Mylan, Indivior, and AstraZeneca each accrued more than $1 billion in financial penalties. Because of settlements reached in 2018-2021, Bristol Myers Squibb, Mallinckrodt, Reckitt Benckiser, and Indivior joined the list of companies with settlements of more than $1 billion. From 1991-2021, 41 companies (four new since 2017) entered into multiple settlements with the federal government; Pfizer (15), Novartis (12), GlaxoSmithKline (9), Bristol Myers Squibb (9), Teva (7), and Merck (7) had the most federal settlements.
Conclusion
Other than a surge in opioid settlements, the number and amounts of federal and state criminal and civil financial settlements against the pharmaceutical industry remained low in 2018-2021. Financial penalties against the pharmaceutical industry continued to pale in comparison to company profits, with the $62.3 billion in penalties from 1991-2021 amounting to a small percentage of the $1.9 trillion in net income made by the 35 largest drug companies during just 19 of those 31 years (2000-2018).[7] Negotiated financial settlements rarely involve admissions of guilt by individuals or companies.
Our findings point to opportunities for states and the federal government to do a better job of holding the pharmaceutical industry accountable, especially for the unlawful promotion of drugs and other medical products and for overcharging government programs. Increased focus by states and the federal government on criminal activity and greater use of whistleblower (qui tam) provisions by states could aid efforts to hold the pharmaceutical industry accountable for its abuses.
Introduction
Public Citizen has published four previous reports— in 2010,[8] 2012,[9] 2016,[10] and 2018[11]— documenting the number and size of criminal and civil settlements and court judgments between federal and state governments and pharmaceutical manufacturers. The 2018 report, which included all settlements from 1991-2017, found that the number of settlements was similar across the years 2014-2017 and that the pace of settlement activity had decreased considerably from the peak years of 2012-2013. The current report analyzes settlements announced from 2018-2021 and includes data from 1991-2021.
Methods
The methodology for this report is identical to that for the 2018 report (see Detailed Methodology). From 1991-2012 pharmaceutical manufacturer settlements of at least $1 million each were tallied. From 2013-2021, all such settlements, regardless of amount, were tallied. This change was made to ensure that totals for smaller states (which are more likely to have smaller settlements) were more fully represented.
Relevant settlements were almost exclusively identified by searching online press archives for the United States and the attorney general websites for all 50 states and the District of Columbia for press releases announcing settlements or judgments against pharmaceutical manufacturers. Rarely, third-party websites, news media coverage, or actual settlement agreements were reviewed (for example, these alternative documents were assessed if a press release did not provide sufficient basic information about the settlements identified). Each press release was reviewed, and basic information (e.g., company, year, dollar amount, description) was extracted and recorded in a spreadsheet database. The spreadsheet was used to prepare the figures and tables in this report.
State settlements refer to those in which the federal government neither was involved in the legal action nor was a party to the final settlement. All other cases were classified as federal, including joint federal–state cases (e.g., those involving Medicaid).
The dollar amounts reported are all nominal (as stated at the time of the settlement announcement) and summarized by year of the settlement (rather than by the year of anticipated payment). There were no adjustments made for inflation over time. Present-value calculations were not made to discount payments promised in future years.
We did not include settlements involving distributors of pharmaceutical products, compounding firms, pharmacy chains, or consulting firms that advised pharmaceutical manufacturers.
Results
Combined trends in federal and state settlements
From 1991-2021, the federal and state governments and pharmaceutical manufacturers reached 482 settlements totaling $62.3 billion (Figure 1 and 2).
For the last four-year period, 2018-2021, there were 70 settlements totaling $23.7 billion. These tallies are slightly lower than the number of settlements (77) and much higher than the overall financial penalties ($5.8 billion) in the previous four-year period (2014-2017).
Federal settlements
From 1991-2021, 214 federal settlements were reached totaling $49.5 billion (Figures 3 and 4).
From 2018-2021, there were 44 federal settlements totaling $14.7 billion, which is similar to 2014-2017, when there were 48 federal settlements. The financial penalties, however, were markedly lower in the 2014-2017 period ($5.2 billion).
In 2020, there were more federal financial penalties against the pharmaceutical industry than in any other year from 1991-2021 (Figure 4). In 2020, opioid settlements accounted for three of the six highest settlements ($9.2 billion, 81% of the total financial penalties). Defendants in these three cases were Purdue Pharma (the manufacturer of the pain medication Oxycontin)[12] and Indivior (the manufacturer of Suboxone film). Suboxone film contains buprenorphine and naloxone and is used to treat opioid use disorder; the medication is taken by dissolving the film under the tongue. The Purdue settlement is part of a years-in-the-making multistate settlement that as of February 2024 was under review by the U.S. Supreme Court.[13],[14],[15] Indivior, which was established as division of Reckitt Benckiser and spun off into a separate company in 2014, had related settlements and sentences in criminal cases.[16],[17] The Indivior settlements involved allegations that the company unlawfully marketed Suboxone film as relatively safe for use around children.
State settlements
From 1991-2021, there were 268 state settlements totaling $12.9 billion (Figures 3 and 4).
From 2018-2021, there were 26 state settlements totaling $9.0 billion, largely attributable to opioid settlements. Most notably, in 2021 six of eight state settlements involved opioid manufacturers, including Johnson & Johnson. In 2021, Johnson & Johnson— as part of a multistate $26 billion settlement that separately penalized opioid distributors McKesson, Cardinal Health and Amerisource Bergen— agreed to pay $5 billion for the company’s role “in creating and fueling the opioid epidemic.”[18] The terms for the Johnson & Johnson settlement included the following: (1) Payment is to be made over a nine-year period, (2) substantial proportions of the penalties are to be spent on “opioid treatment and prevention,” (3) both litigating and nonlitigating states and localities are to be beneficiaries, and (4) 10 years after the agreement Johnson & Johnson is expected to stop selling or otherwise promoting opioids.
Single-state settlements
From 1991-2021, 228 (85%) of the 268 state settlements were negotiated by a single-state. Of the $12.9 billion in total state financial penalties, $4.7 billion (36%) was recovered from single-state settlements (Figures 5 and 6). In 2019 and 2021, there were notable spikes in single-state settlements that were driven by opioid settlements. In 2019, opioid settlements accounted for 57% of the $1.2 billion in single-state settlements, and alleged overcharging of government programs related to numerous drugs (not specified in the press releases) accounted for 31%. For example, in 2019 Teva entered into a $135 million settlement with Illinois because the drugmaker allegedly overstated the wholesale prices of numerous drugs, leading to excessive charges to the state’s Medicaid program.[19] According to the Illinois attorney general, related litigation and lawsuits dating back to 2005 led to the recovery of more than $436 million.
From 1991-2021, 34 states reached at least one single-state settlement with a pharmaceutical company (Table 1). From fiscal years 2001-2021, Hawaii, Oklahoma, New Mexico, South Carolina, and Texas recovered the most in financial penalties as a proportion of state Medicaid prescription drug expenditures, with recoveries of 160% for Hawaii and 4% to 9% for the four other state Medicaid programs’ spending on drugs over that period (Table 1, column 2). The 34 states with at least one single-state settlement recouped a median of slightly less than 1% ($8.55 per $1,000) of their total fiscal year 2001-2021 Medicaid drug expenditures through these settlements.
Hawaii’s relative recoveries were greatly increased by a single 2021 case that accounted for $834 million of the $917.8 million recovered by the state from 1991-2021.[20] That $834 million recovery followed a court order against Bristol Myers Squibb and Sanofi for unlawful promotion of clopidogrel (PLAVIX), a drug used to reduce the risk of cardiovascular events such as heart attacks, strokes, and blood clots. The plaintiffs alleged that the companies knew as early as 1998 that this drug was not effective in some patients, including Asians and Pacific Islanders, but these companies only began warning Hawaiian physicians in 2010. The court agreed and penalized the defendants $1,000 for each of the 834,012 clopidogrel dispensing-units (e.g., prescriptions and refills) issued in the state during the time covered by the court order. That judgment followed a four-week trial that ended in November 2020, the Hawaiian Circuit Court found that the companies “knowingly placed Plavix patients at grave risk of serious injury or death in order to substantially increase their profits.” The Court further found the company’s behavior was “immoral, unethical, oppressive and unscrupulous.”
Of the 34 states with at least one single-state settlement, 28 (82%) had a false claims statute as of 2021. A false claims statute bars fraud in connection with government programs (e.g., Medicare or Medicare) when they purchase goods or services (e.g., drugs or medical procedures) and provides the government with a means to hold those who commit fraud financially accountable, for example by providing for treble damages. Among the 13 states with the strongest acts, the average recovery was $139.39 per $1,000 of Medicaid drug expenditures. For the 15 states with weaker acts, the average recovery was $17.48 per $1,000 of Medicaid drug expenditures; for the six states with no false claims act, the average recovery was $20.21.
Of the 34 states with at least one single-state settlement, 15 have attained a return on investment (ROI) of $1 or greater per Medicaid fraud enforcement dollar spent, meaning the state recouped enough money from these settlements alone to offset their entire Medicaid fraud enforcement budgets (from fiscal years 2006-2020; see Table 1). Hawaii, Oklahoma, South Carolina, and Alabama had especially high ROIs, realizing between $7.28 and $40.43 for every $1 spent (from 2006-2020) on enforcement related to Medicaid fraud.
Overall, from 1991-2021, the $3.0 billion recovered in single-state settlements by the top five states (Hawaii, Texas, Oklahoma, Illinois, and Louisiana) represented 64% of all single-state penalties. Louisiana had the most single-state settlements (55), followed by Kentucky (21) and Texas (21).
Multistate settlements
From 1991-2021, there were 40 multistate settlements totaling approximately $8.2 billion, representing 15% of state settlements and 64% of state financial penalties. In 2020, there was a $1.6 billion multistate settlement involving unlawful promotion of opioids by Mallinckrodt, and in 2021 the $5 billion Johnson & Johnson opioid settlement described above. During the 31-year period, every state participated in at least nine multistate settlements. Three of the 40 multistate settlements involved all 50 states and the District of Columbia. States participated in a median of 27 multistate settlements. Arizona, Florida, and Texas participated in the most multistate settlements (34 each), followed by Massachusetts, North Carolina, and Vermont (33 each) (Table 2). A limitation to this analysis of multistate settlements is that information for individual state shares was only explicitly noted in press releases for 43% of the dollars recovered ($3.6 billion of $8.2 billion).
Single-state and multistate settlement totals and state False Claims Act status
Table 3, Panel A shows the number of settlements from 1991-2021 (both single-state and multistate), total financial penalties, and whether a state had a False Claims Act as of 2021 for all 50 states and the District of Columbia. Louisiana (71 settlements), Texas (55), Kentucky (44), Idaho (43), and Massachusetts (43) participated in the most settlements, whereas New Hampshire (15), Alaska (14), Georgia (12), and Wyoming (9) participated in the fewest.
Table 3, Panel B shows state settlement activity for states with “no,” “weak,” or “strong” False Claims Acts. The strongest of such provisions include whistleblower (qui tam) provisions, as discussed in more detail below. Six states had no False Claims Acts, 22 states had acts with weak provisions, and 23 states had acts with strong provisions. Regardless of False Claims Act status, there were approximately 30 settlements per state. Financial penalties for the states with no or weak acts were about $150 million per settlement. For the states with strong acts, the average financial penalty per settlement was $237 million. California, New York, and Texas are examples of states with strong acts.
Civil and criminal settlements
From 1991-2021, there were 416 civil settlements, 47 mixed civil and criminal settlements, and 19 criminal settlements against pharmaceutical companies, totaling $46.9 billion in civil penalties and $15.5 billion in criminal penalties (Figures 7 and 8). Of the criminal penalties, 95% were federal.
Although the distinction between criminal and civil litigation is complex and there can be substantial overlap between the two litigation forms in terms of the alleged wrongful act’s severity (heinousness), this paragraph aims to offer a few general ‘rules of thumb’ for lay readers regarding the differences between these two legal constructs. Civil cases rarely involve jail time or probation for individuals, instead they rely on monetary penalties. Moreover, the standard in civil cases is a “preponderance” of the evidence rather than the standard in criminal cases of “beyond a reasonable doubt.” Plaintiffs (those bringing the suit) in civil actions can be almost anyone (whereas in criminal cases the government is almost always enforcing a specific code or law). Finally, a civil case can generally be resolved with more flexibility than a criminal case.[21],[22],[23]
A recent case that did involve criminal prosecution was the 2020 Purdue Pharma opioid settlement. The $5.5 billion settlement included an additional $2.8 billion in civil penalties (Figure 8). Approved by a New York bankruptcy court in November 2020, the settlement followed directly from a guilty plea from the company on three felony counts related to defrauding the government, enticing prescribers with kickbacks, and overselling opioids despite knowing they were being diverted for misuse.[24] Although the settlement involved criminal allegations against the company, it did not resolve criminal liability against members of the Sackler family. Moreover, state-based civil claims and future liability borne by the Sackler family are tied up in a bankruptcy dispute that, as of mid-March 2024, was pending a decision by the U.S. Supreme Court.[25],[26] The key question is whether a $6 billion proposed payment from the Sackler family is sufficient punishment for the family to be relieved of all other civil liability pertaining to this case. Concerns remain that such a blanket release from liability should not be extended under a bankruptcy proceeding and that the family has squirreled away more than $11 billion stemming from Purdue Pharma profits. Of note, the terms of the settlement require that the company be reorganized to exclude the Sackler family and to rebrand the company as a public interest firm called Knoa.[27]
From 2018-2021, criminal actions, with or without individual defendants, were much less common than civil actions against pharmaceutical manufacturers. An exception was 2020, when there were 19 cases, nine of which had criminal components, including the Purdue case (Figure 7). Five of the nine criminal cases involved opioids. Other opioid cases included Indivior for its unlawful promotion of Suboxone film[28] and Insys Therapeutics for unlawful promotion of a fentanyl product.[29] The Insys case was against Michael Babich, in which he agreed to pay $2 million to the state of Arizona to settle allegations of paying kickbacks to physicians to encourage the use of the company’s product. Babich also agreed to cooperate with ongoing investigations. The terms of this settlement further barred Babich from selling or marketing pharmaceuticals in Arizona.
Two criminal cases resolved in 2020 involved price fixing[30],[31] and two involved bribing foreign officials to support the marketing of the company’s drugs.[32],[33] Four of the nine 2020 criminal cases involved individual defendants. According to our research, only three company officials were sentenced to any personal confinement— the CEO of Indivior was sentenced to six months of home detention and 100 hours of community service;[34] John Kapoor, the founder of Insys, was sentenced to 66 months imprisonment;[35] and Alec Bulakoff, the sales chief at Insys, was sentenced to 26 months in prison. Among the more salacious allegations that led to the Insys convictions was that the company hired a stripper as a sales representative to persuade doctors to increase use of Insys’ fentanyl spray product. According to a report from National Public Radio, that individual eventually directed a substantial proportion of Insys’ sales force.
From 2018-2021, the most common statutes cited in the 18 criminal settlements were the False Claim Act (8) and the Food, Drug, and Cosmetic Act (5). Civil settlements most commonly mentioned the False Claims Act (29 of 60 cases); only two cases mentioned the Food, Drug, and Cosmetic Act. Similar patterns were evident in 2016-2017.
False Claims Act and qui tam (whistleblower) settlements
Enacted in 1863 to address military contractor fraud during the Civil War, the federal False Claims Act (31 U.S.C. §§ 3729-3733)[36] has become the federal government’s “primary civil tool to redress false claims against federal funds and property” across a wide variety of government operations.[37] During fiscal years 1986-2020, the federal government used the False Claims Act, or related federal fraud provisions, to recover approximately $64 billion.[38] In fiscal year 2020, there were $2.2 billion in False Claims Act settlements, $1.8 billion of which pertained to the health care industry broadly.
From fiscal years 1991-2021, the pharmaceutical industry paid at least $18.1 billion in financial penalties to the federal government under the False Claims Act, more than three times the $5.8 billion that the defense (military) industry paid under the act. From fiscal years 2018-2021, the pharmaceutical industry continued to outpace the defense industry in such payouts (Figure 9), with $6.0 billion in payments, compared with $528 million by the defense industry. For most of the fiscal years 2002-2021 (except for 2003, 2006, 2015, and 2018) pharmaceutical industry penalties under the False Claims Act have greatly exceeded those for the defense industry.
A critical component of the False Claims Act is the whistleblower provision, which provides a financial incentive to people with inside-the-company information who expose wrongdoing.[39] From 1991-2021, whistleblower cases, brought mostly under the False Claims Act, were responsible, at least in part, for 112 of 214 (52%) federal settlements, and $29.3 billion of $49.6 billion (60%) in federal penalties. From 2018-2021, whistleblower financial penalties were similar to those from 2014-2017, but markedly lower than those observed from 2010-2013 (Figures 10 and 11). By contrast, from 1991-2013 (other than from 2010-2013), state qui tam litigation was rare. After 2013, only one such state qui tam settlement (for $64 million) was found (Figures 12 and 13).
Worst offenders, repeat offenders, and largest settlements
Table 4 presents information about the 20 companies that paid the most in financial penalties to federal and state governments from 1991-2021. Purdue ($9.0 billion), Johnson & Johnson ($8.4 billion), GlaxoSmithKline ($7.9 billion), and Pfizer ($7.8 billion) accounted for 48% of all financial settlements. Table 4 further shows that 16 pharmaceutical manufacturers paid at least $1 billion in financial penalties from 1991-2021; 11 of these firms have each been penalized in 10 or more different cases.
Table 5 shows the number of federal settlements and total financial penalties for the companies with at least three federal settlements during the study period. Pfizer had the most federal settlements (15), followed by Novartis (12), and GlaxoSmithKline (9) and Bristol Myers Squibb (9).
Table 6 lists the 20 largest financial settlements of any kind from 1991-2021; six individual settlements (two each from GlaxoSmithKline and Johnson & Johnson) exceeded $2 billion. The two largest settlements were the Purdue Pharma 2020 opioid settlement ($8.3 billion) followed by the 2021 Johnson & Johnson opioid settlement ($5 billion). From 2018-2021, other large individual settlements were additional opioid settlements (Mallinckrodt, Indivior), the $834 million Hawaii clopidogrel settlement against Bristol Myers Squibb and Sanofi, and a $678 million settlement involving 26 states and the federal government with Novartis, alleging kickbacks to patients and clinicians to inflate the use of several medications for multiple sclerosis, cancer, high blood pressure, and diabetes.[40] In the Novartis case, the kickbacks were alleged to have been paid to doctors as cash, meals, and entertainment to encourage prescribing.[41]
Types of violations
The categories of violations are defined in Table 7. From 1991-2021, overcharging of government health programs (mainly drug-pricing fraud against state Medicaid or the federal Department of Veterans Affairs) was cited in more settlements (210) than any other violation and accounted for 39% of all the violations noted (Figure 14). The number of settlements involving overcharging of government health programs increased from 2008 (16 settlements) to 2013 (41 settlements) and subsequently decreased to less than five settlements per year (Figure 15).
From 1991-2021, settlements involving unlawful promotion resulted in the most financial penalties ($22.3 billion, 36% of all financial penalties) (Figure 16), with large opioid cases, both state and federal, contributing to a resurgence of such settlements (Figure 17 and Figure 18). These opioid cases typically involved allegations that manufacturers oversold the safety of opioids despite the substantial risks of misuse and dependence. Figure 17 shows pharmaceutical industry financial penalties specifically for unlawful promotion from 1991-2021, and Figure 18 shows the amount of financial penalties in settlements that involved both unlawful promotion and other types of violations.
Discussion
This analysis of pharmaceutical industry civil and criminal financial settlements from 1991-2021 found that the number and size of federal and state enforcement actions remains low. During the 31 years reviewed, the total penalties paid by the pharmaceutical industry to either state or federal governments was $62.3 billion in settlement-year dollars. Though $62.3 billion may seem a substantial sum, it is a small percentage of the profits of the pharmaceutical industry during the study period. An analysis covering just 19 of those 31 years (2000-2018) found that 35 of the largest publicly traded pharmaceutical companies had net income of $1.9 trillion (2016 dollars). As of 2021, there were more than 5,000 pharmaceutical firms.[42]
From 2018-2021, there were 70 state or federal pharmaceutical settlements totaling $23.7 billion. The number of settlements was similar in 2014-2017; however, the total financial penalties were much higher, a difference largely driven by the seven large settlements in 2018-2021 that were related to the opioid epidemic.
Opioid settlements
In 2020, the largest settlement was federal and against Purdue Pharma for $8.3 billion. Purdue as a company pleaded guilty to three felony counts for selling dangerous opioid products even though the firm had reason to believe their products were being diverted for illicit use. The civil and criminal penalties further involved lying to the Drug Enforcement Agency, fraudulently increasing manufacturing quotas, and offering kickbacks to entice doctors to prescribe Purdue’s pain medications oxycodone (Oxycontin) and hydrocodone (Hysingla ER). According to the Department of Justice press release announcing this settlement, “Purdue put opioid profits ahead of people and corrupted the sacred doctor-patient relationship.”[43]
In 2021, the largest settlement was a multistate action against Johnson & Johnson for $5 billion.[44] This settlement for the company’s role in fueling the opioid crisis was part of a $26 billion settlement that separately included the three largest opioid distributors: Amerisource Bergen, Cardinal Health, and McKesson. The Johnson & Johnson penalty of $5 billion will be split across participating states, cities, and counties, and paid over 10 years.
In our 2018 report (which focused on 2016-2017), opioid-related lawsuits by states and localities were already prominent among the settlements with the pharmaceutical industry.[45] In the 2018-2021 period, these settlements surged. This surge is plausibly tied to the final stages of litigation that began around 2011 as prescription opioid overdose deaths plateaued. Subsequently, there have been more overdose deaths related to synthetic opioids, especially fentanyl.[46] The surge in opioid-related lawsuits and settlements also may be related to the Trump administration’s prioritization of this issue[47] and industry’s interest in resolving such litigation under a Trump rather than a Biden administration.[48]
State and federal settlement activity
From 2015-2021 federal actions against the pharmaceutical industry were more common, and financially rewarding, than state actions. The exception was 2021, when there were sizable state-based opioid settlements (Figures 3 and 4). From 2015-2021, the number of single-state settlements was almost always markedly higher than multistate settlements with increases in financial amounts from 2019-2021 related to opioid settlements as well as three large non-opioid cases. These trends are consistent with the notion that, although federal and multistate prosecutorial efforts can be effective, actions by a single state can also achieve substantial settlements. The case that demonstrates this the best is the $834 million clopidogrel settlement won by Hawaii against Bristol Myers Squibb and Sanofi. The case is also important because it highlighted a specific pharmaceutical-based racial disparity: a failure to warn Asian and Pacific Islander patients about the health risks of the blood thinner.[49]
Illinois had two large single-state settlements; both lawsuits were initiated in 2005 and settled in 2019. The cases involved dozens of companies and led to $377 million in payments to settle allegations that they inflated the prices of various drugs to obtain excessive Medicaid reimbursements.[50],[51]
As was the case in our 2018 report, overcharging of government health programs, especially Medicaid and the Department of Veterans Affairs, was the most common type of pharmaceutical industry violation observed. Since peaking in 2013, the frequency of this violation has declined (Figure 15). One likely explanation is the resolution of a Medicaid drug-pricing scandal after the federal government ruled that Medicaid programs reimburse for pharmaceuticals based on actual drug acquisition costs rather than average wholesale prices, which are often inflated.[52] Our 2018 report also noted that the number of state-based prosecutions likely decreased because many states had to simultaneously deal with limited legal budgets, successful pushback from industry that included laws to curb states from retaining outside counsel, and the expansion of opioid-related legal actions.
State False Claims Acts
Our analysis suggests a correlation between the strength of a state’s False Claims Act and the size of settlements. States with stronger laws often had larger settlements (Table 3, Panel B). Interpretation of this correlation is complicated by the fact that some of the largest states (California, New York, Texas) also have strong False Claims Act provisions.
Whistleblower provisions
Although whistleblower (qui tam) complaints continue to be a frequent feature of federal litigation against the pharmaceutical industry, we found that they are rarely used in state cases (Figures 10-13). Greater use of whistleblower complaints could bolster state enforcement efforts. The Department of Justice regularly stresses the importance of qui tam provisions under the federal False Claims Act.[53],[54] In federal fiscal year 2020, the Department of Justice initiated 647 cases under the act and recovered $1.6 billion related to qui tam actions; 15% to 30% of the financial recoveries went to a whistleblower.
Criminal versus civil litigation and the Park Doctrine
Civil settlements and judgments, not criminal actions, have dominated state and federal penalties assessed against pharmaceutical manufacturers (Figures 7 and 8).
Despite a few convictions, such as the conviction of Insys executives for bribing physicians to prescribe fentanyl, our findings suggest that states and the federal government have been reluctant to charge and seek the imprisonment of pharmaceutical company officials for criminal activities.
Under the Park Doctrine, named for a 1975 Supreme Court case called United States v. Park, “responsible corporate officers” of a drug or device company can be convicted of criminal misdemeanors for misconduct within their companies.[55] Importantly, a conviction, including up to a year in prison, can be based on the wrongdoing itself and the officer’s position of authority to prevent or correct the violation, even absent direct knowledge of, or intent pertaining to, the wrongdoing.
Our 2018 report found only one Park Doctrine case between 1991-2017 that led to the jailing of a pharmaceutical executive. That report noted “the difficulty that the federal government faces in holding executives accountable for even admitted wrongdoing by their companies,” and added that the government had been “exceedingly reluctant to wield” the authority it has under the Park Doctrine.
A 2022 study identified only six drug or device Park Doctrine cases between 2000-2021: three cases involving pharmaceutical manufacturers, two involving medical-device makers, and one involving a pharmacy compounding firm.[56] Of the 13 executives who were prosecuted, there were 11 guilty pleas and two jury trials leading to two convictions. Concluding that “the government has not exercised the full scope of its authority to prosecute corporate officials responsible for the illegal behavior of the drug and device companies they run,” the researchers called for a reinvigoration of the Park Doctrine and for the president, Food and Drug Administration, Department of Justice, and Congress to take actions supporting that goal.
Unlawful, including off-label, promotion
From 1991-2021, settlements involving unlawful promotion resulted in the most financial penalties ($22.3 billion, 36% of all financial penalties) against the pharmaceutical industry (Figure 16), with large state and federal cases involving opioids accounting for the increased number of such settlements from 2018-2021 (Figures 17 and 18).
Our 2018 report also found that unlawful promotion was the most common category in terms of dollars recovered, but attributed most of that signal to off-label promotion, the marketing of a drug for purposes not approved by the FDA. Off-label promotion is a violation typically pursued under the Food Drug and Cosmetics Act. The dearth of off-label promotion actions in recent years may reflect adaptation by industry to avoid such charges, but alternatively it may reveal inadequate government enforcement coinciding with the expansion of direct-to-consumer advertising and efforts by industry to assert “free speech” rights over scientific findings by the FDA. Whatever the case, our data show unlawful promotion actions against pharmaceutical manufacturers remain relatively low except for a few large opioid settlements. Moreover, stratification of the financial data from unlawful promotion cases into state and federal actions show that in 2020-2021 recoveries were especially lucrative because of three large opioid settlements against: Mallinckrodt (2020, $1.6 billion, multi-state), Purdue (2020, $8.3 billion, federal) and Johnsons & Johnson (2021, $5 billion, multi-state).
Limitations
The main limitation of this report is that the information is based almost entirely on press releases from the Department of Justice and state attorney general websites. When a settlement is reached, there is no requirement for a press release to be issued. Moreover, the wording of a press release may overstate the legal accomplishments. Accordingly, our analysis likely missed the following types of plausibly illuminating information:
- Settlements that were not promoted in a government press release available on the internet.
- Legal actions or concerns that went unresolved or were otherwise neglected.
- Settlement details not included in press releases, including particulars about specific legal strategies (e.g., use of the False Claim Act whistleblower and/or unlawful promotion provisions) and corporate integrity or leniency agreement requirements (e.g., mandated reporting, ceasing activity), in addition to penalties.[57]
Typically, the press releases that we reviewed announced an agreement that had yet to be implemented. Thus, there are additional limitations of this report:
- The implementation of agreements or punishments may be modified, reversed, or delayed.
- Dollar amounts are for the settlement year and not adjusted for inflation.
- Follow-up information about whether the monetary or nonmonetary terms of an agreement were fulfilled was not assessed. For example, corporate integrity or leniency agreements were not reviewed or tracked for compliance.[58] Moreover, corporate bankruptcies may greatly complicate settlements.[59]
- Follow-up information about the disposition of the money recovered was not assessed. We did not assess how funds from the settlements were used (e.g., patient compensation, disease prevention, general government funding). Assessing how the funds from the settlements are used is essential. Illustrative of this concept is that the long-term effects of the $206 billion, 46-state tobacco settlement, reached in 1998, remain an important public health concern. Less than 5% of the tobacco settlement funds have been used to finance smoking cessation and prevention efforts.[60]
Finally, this report was limited to government settlements with pharmaceutical manufacturers. Settlements with distributors, compounding firms, or retail pharmacies (such as pharmacy chains) were not tabulated, nor were settlements with pharmaceutical consulting or marketing firms.[61] Other than aggregate comparisons to defense-industry settlements (Figure 9) and Medicaid drug and enforcement budgets (Table 1), settlements were not compared with those for other major industrial or service sectors.
Conclusions
From 1991-2021, states and the federal government initiated legal actions against the pharmaceutical industry that yielded 482 individual settlements and judgments and more than $62 billion in financial penalties. Although some of the financial penalties were substantial, the total amount was a small percentage of the net income of the pharmaceutical industry during the study period. Moreover, the cases rarely addressed criminal activity or led to the imprisonment of company officials for the commission of illegal acts. The total amount of federal settlement penalties ($49.5 billion) was substantially greater than the total amount of state settlements ($12.9 billion). However, three of the largest 20 settlements were state cases, including two large multistate opioid settlements.
Our findings point to opportunities for states and the federal government to do a better job holding the pharmaceutical industry accountable, especially for the unlawful promotion of drugs and other medical products and for overcharging government programs. Increased focus by states and the federal government on criminal activity and greater use of false claims statutes could aid efforts to hold the pharmaceutical industry accountable for its abuses.
Summary Data Figures and Tables
Figure 1. Number of Pharmaceutical Industry Settlements, 1991-2021

Figure 2. Pharmaceutical Industry Financial Penalties, 1991-2021

*Seven of the 12 highest settlements in 2020 and 2021 were for opioids. The seven settlements account for $16.3 billion (81%) of the nearly $20 billion in settlements for the two-year period 2020 to 2021.
Figure 3. Number of Pharmaceutical Industry Settlements, 1991-2021: Federal vs. State*

*State settlements refer to those in which the federal government neither was involved in the investigation responsible for the settlement nor was a party to the final settlement, as determined through a review of the press release. All other cases were classified as federal, including joint federal–state cases (e.g., those involving Medicaid where federal authorities were involved in the litigation).
Figure 4. Pharmaceutical Industry Financial Penalties, 1991-2021: Federal vs. State*

*State settlements refer to those in which the federal government neither was involved in the investigation responsible for the settlement nor was a party to the final settlement, as determined through a review of the press release. All other cases were classified as federal, including joint federal–state cases (e.g., those involving Medicaid where federal authorities were involved in the litigation).
** Three of the six highest federal settlements in the year 2020 were for opioids (Purdue and Indivior [two settlements]) and account for $9.2 billion (81%) of the $11.3 billion in that category-year.
*** Six of the eight state settlements in the year 2021 were for opioids (Johnson & Johnson, Allergan, Endo [two settlements], Insys, and Collegium), and these six settlements accounted for $5.4 billion (87%) of the $6.2 billion in that category-year.
Figure 5. Number of State Pharmaceutical Industry Settlements, 1991-2021: Multistate vs. Single-State*
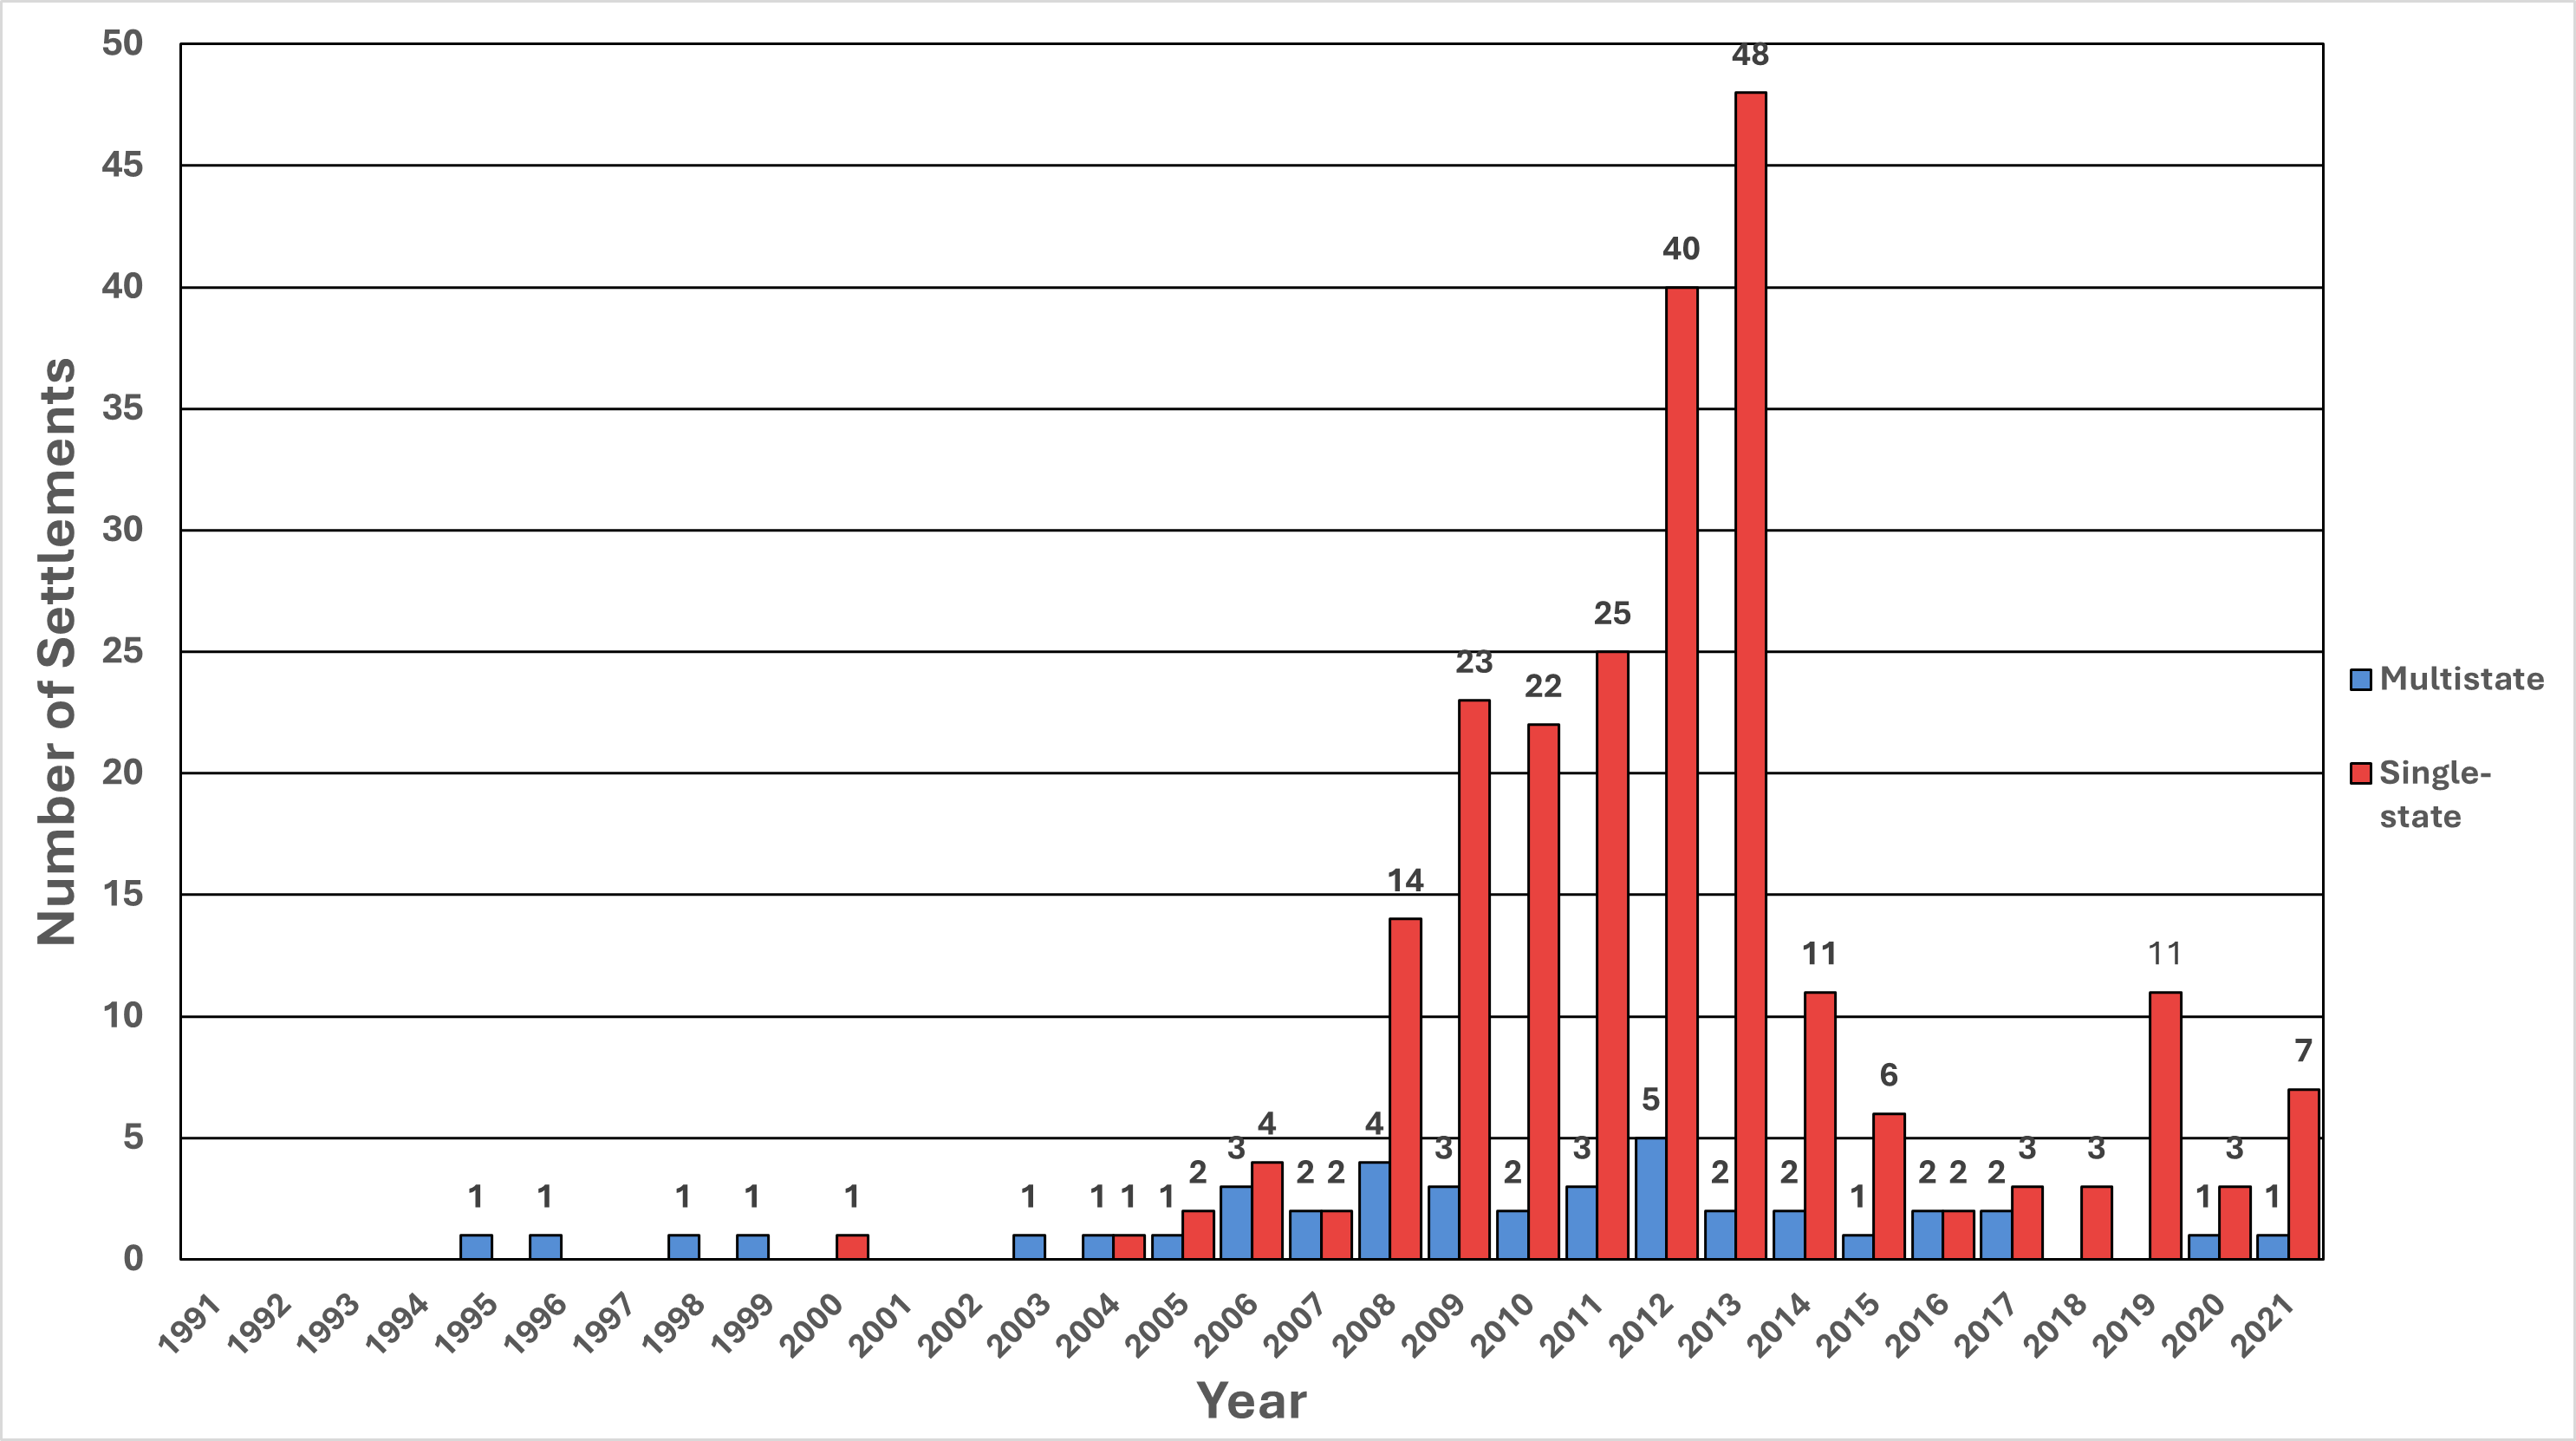
*Single-state settlements were those in which only one state was a party to the final settlement, as gleaned from the information provided in the press release. All other state settlements were classified as multistate.
Figure 6. State Pharmaceutical Industry Financial Penalties, 1991-2021: Multistate vs. Single-State*

*Single-state settlements were those in which only one state was a party to the final settlement, as gleaned from the information provided in the press release. All other state settlements were classified as multistate.
** Three of the highest seven single-state settlements in 2019 were for opioids (Johnson & Johnson and Teva [2 settlements]) and accounted for $702 million (57%) of the $1.2 billion for that category-year. Alleged overcharging of government programs for various drugs by multiple firms in one lawsuit (Abbott, Aventis, B. Braun, Forest Labs, GlaxoSmithKline, Johnson & Johnson, Janssen, McNeil-PPC, Ortho Biotech, Novartis, Pfizer, Pharmacia and TAP) and Teva alone in another lawsuit accounted for $377 million (31% of the total).
*** Only one multistate settlement occurred in 2020: $1.6 billion promised by Mallinckrodt for alleged unlawful promotion of opioids.
**** Only one multistate settlement, for $5 billion, was reached in 2021 for alleged unlawful marketing of opioids by Johnson & Johnson. Three of the highest four single-state settlements accounted for $313 million (27%) of the $1.1 billion in such opioid settlements for 2021. The largest single state-only settlement was a court order of a $834 million penalty (72% of the category-year total) in 2021 and was obtained from Bristol Myers Squibb and Sanofi for unlawful promotion for clopidogrel.
Table 1. Single-State Settlement Totals, 1991-2021
| State | Recoveries per $1,000 Medicaid Prescription Drug Expenditures ($)* | Total Financial Penalties ($ million)** | Number of Settlements and Judgments | ROI (Dollars Recovered per Enforcement Dollar Spent [$])*** | FCA as of 2021**** |
|---|---|---|---|---|---|
| Hawaii ‡ | 1,602.81 | 917.75 | 3 | 40.43 | YES |
| Oklahoma | 94.20 | 665.75 | 3 | 15.10 | YES |
| New Mexico | 89.64 | 34.10 | 2 | 0.97 | Y |
| South Carolina | 43.94 | 169.00 | 2 | 7.28 | Y |
| Texas | 41.62 | 710.60 | 21 | 2.22 | YES |
| Louisiana | 34.63 | 298.84 | 55 | 3.21 | Y |
| Pennsylvania | 32.98 | 163.90 | 8 | 1.47 | |
| Illinois | 31.74 | 395.60 | 6 | 2.40 | YES |
| Kentucky | 30.19 | 155.54 | 21 | 3.17 | Y |
| Mississippi | 25.42 | 113.82 | 15 | 2.49 | |
| Idaho | 21.33 | 38.10 | 16 | 3.35 | |
| Arizona | 18.49 | 11.50 | 2 | 0.29 | |
| Alabama | 17.64 | 124.25 | 9 | 7.96 | |
| Utah | 14.42 | 28.50 | 3 | 0.97 | Y |
| New York | 13.56 | 256.28 | 8 | 0.32 | YES |
| Alaska | 13.06 | 15.00 | 1 | 0.83 | Y |
| West Virginia | 10.44 | 44.50 | 2 | 1.91 | Y |
| California | 6.65 | 233.06 | 5 | 0.46 | YES |
| Massachusetts | 5.85 | 50.81 | 10 | 0.67 | YES |
| Wisconsin | 5.66 | 46.25 | 6 | 1.93 | Y |
| Ohio | 5.43 | 57.44 | 3 | 0.68 | |
| New Hampshire | 5.33 | 3.40 | 1 | 0.26 | Y |
| Nevada | 4.64 | 9.50 | 1 | 0.35 | YES |
| Montana | 4.40 | 5.90 | 1 | 0.50 | YES |
| Kansas | 3.74 | 5.70 | 2 | 0.29 | Y |
| Oregon | 3.69 | 8.97 | 6 | 0.27 | Y |
| Connecticut | 3.36 | 27.60 | 2 | 1.09 | YES |
| Missouri | 2.80 | 37.00 | 3 | 1.02 | Y |
| Maryland | 2.55 | 15.00 | 1 | 0.27 | Y |
| Iowa | 1.67 | 4.30 | 2 | 0.26 | YES |
| North Carolina | 1.59 | 25.93 | 2 | 0.29 | YES |
| Florida | 1.04 | 15.00 | 2 | 0.05 | Y |
| New Jersey | 1.04 | 6.30 | 3 | 0.09 | Y |
| Colorado | 0.01 | 0.06 | 1 | 0.00 | YES |
| Total / Median | 8.55 [median] | 4,695.23 [total] | 228 [total] | 0.90 [median] | 28 (Y or YES) / 34 [total] |
*Calculated by dividing single-state financial penalties (“Total Financial Penalties” column) from October 1, 2000 (FY 2001; the earliest single-state settlement), through 2021 by each state’s Medicaid prescription drug expenditures from FY 2001 through FY 2021 (the most recent year for which data were available from Medicaid’s website with Form 64 data). These figures are an approximation, as there is usually a several-year lag between any alleged fraudulent activity and the date on which that settlement is finalized. (File source: https://www.medicaid.gov/medicaid/financial-management/state-expenditure-reporting-for-medicaid-chip/expenditure-reports-mbescbes/index.html, Accessed April 10, 2023 to get FYs 2016– 2021).
**Unlike for multistate settlements, financial penalties obtained through single-state settlements presented in this table more fully represent a comprehensive list of such penalties because single-state settlement press releases typically state the anticipated settlement amount.
***Return on Investment (ROI) was calculated by dividing single-state financial penalties (“Total Financial Penalties“ column) from October 1, 2000 (the earliest single-state settlement), through 2020 by the state’s total Medicaid Fraud Control Unit (MFCU) budgets from FY 2006 (the earliest year for which data are available) through FY 2020 as obtained from the National Association of Medicaid Fraud Control Units (NAMFCU) 2006-2021 surveys at https://naagweb.wpenginepowered.com/wp-content/uploads/2022/03/Statistics-2021.pdf. Accessed April 11, 2023. These ROIs are an approximation, as all enforcement activities may not have been conducted by state MFCUs, and there is usually a several-year lag between the time an investigation is initiated and when the settlement is finalized.
****False Claims Act (FCA) as of FY 2021, as determined from the NAMFCU 2021 survey (see Detailed Methodology). YES = that the FCA is Deficit Reduction Act (DRA)-compliant, including strong qui-tam provisions. Y = denotes a less strong FCA provision in place. Note that settlements may have been finalized prior to the enactment of the state’s FCA.
‡ The substantial increase in recoveries and penalties since 2017 observed for Hawaii is because of a court decision in 2021 for $834 million obtained from Bristol Myers Squibb and Sanofi for unlawful promotion for clopidogrel in that state.
Table 2. Multistate Settlement Totals, 1991-2021
| State | Number of Settlements and Judgments | Verifiable Financial Penalties ($ million)* | FCA as of 2021** | State | Number of Settlements and Judgments | Verifiable Financial Penalties ($ million)* | FCA as of 2021** |
|---|---|---|---|---|---|---|---|
| Arizona | 34 | 130.83 | New Jersey | 26 | 147.29 | Y | |
| Florida | 34 | 366.17 | Y | South Dakota | 26 | 22.85 | Y |
| Texas | 34 | 398.41 | YES | Delaware | 25 | 32.77 | Y |
| Massachusetts | 33 | 122.27 | YES | Nebraska | 25 | 3.69 | Y |
| North Carolina | 33 | 184.19 | YES | Hawaii | 24 | 1.18 | YES |
| Vermont | 33 | 30.60 | YES | Minnesota | 24 | 56.92 | Y |
| California | 32 | 51.45 | YES | Colorado | 23 | 15.70 | YES |
| Maryland | 32 | 102.72 | Y | Kentucky | 23 | 99.52 | Y |
| Wisconsin | 32 | 94.38 | Y | North Dakota | 23 | 0.00 | Y |
| Illinois | 31 | 203.38 | YES | New Mexico | 22 | 4.81 | Y |
| Nevada | 31 | 17.19 | YES | Rhode Island | 22 | 10.50 | YES |
| Tennessee | 31 | 27.05 | YES | Montana | 20 | 4.48 | YES |
| Michigan | 30 | 162.74 | Y | Indiana | 19 | 115.48 | YES |
| New York | 30 | 296.52 | YES | Oklahoma | 19 | 0.00 | YES |
| Ohio | 30 | 29.76 | South Carolina | 19 | 0.00 | Y | |
| Washington | 30 | 25.21 | YES | Alabama | 18 | 0.00 | |
| Connecticut | 29 | 72.13 | YES | Virginia | 17 | 112.14 | YES |
| District of Columbia | 29 | 14.92 | Y | West Virginia | 16 | 1.85 | Y |
| Pennsylvania | 29 | 227.86 | Louisiana | 15 | 65.44 | Y | |
| Missouri | 28 | 22.03 | Y | Alaska | 14 | 2.86 | Y |
| Oregon | 28 | 94.74 | Y | Mississippi | 14 | 1.12 | |
| Arkansas | 27 | 51.14 | Y | New Hampshire | 14 | 5.00 | Y |
| Idaho | 27 | 15.64 | Utah | 14 | 61.09 | Y | |
| Iowa | 27 | 45.39 | YES | Georgia | 12 | 4.63 | YES |
| Kansas | 27 | 0.70 | Y | Wyoming | 9 | 0.00 | Y |
| Maine | 27 | 9.88 | Y | ||||
*Financial penalties include an incomplete sample ($3.57 billion, or 43%) of financial penalties from multistate settlements, i.e., only individual state settlement shares that were publicly available in press releases over the time period. Therefore, state performance in multistate settlement activity is driven by the number of settlements, not the financial penalties, attributed to each state in this table. Some states (North Dakota, Oklahoma, South Carolina, Alabama, and Wyoming) had no individual state shares listed in press releases, explaining the “0.00” values for a few financial penalties.
**False Claims Act (FCA) as of FY 2021, as determined from the NAMFCU 2021 survey (see Appendix 2). YES = the FCA is Deficit Reduction Act (DRA)-compliant, with strong qui tam provisions. Y = less strong FCA provisions in place. Note that settlements may have been finalized prior to the enactment of the state’s FCA.
Table 3, Panel A. Overall State Settlement Totals, 1991-2021
| State | Number of Settlements and Judgments | Verifiable Financial Penalties ($ million)* | FCA as of 2021** | State | Number of Settlements and Judgments | Verifiable Financial Penalties ($ million)* | FCA as of 2021** |
|---|---|---|---|---|---|---|---|
| Louisiana | 71 | 695.27 | Y | Mississippi | 29 | 114.93 | |
| Texas | 55 | 1,109.01 | YES | New Jersey | 29 | 153.59 | Y |
| Kentucky | 44 | 255.06 | Y | Arkansas | 28 | 1,252.14 | Y |
| Idaho | 43 | 53.74 | Alabama | 27 | 124.25 | ||
| Massachusetts | 43 | 173.08 | YES | Hawaii | 27 | 918.93 | YES |
| Wisconsin | 40 | 154.23 | YES | Maine | 27 | 9.88 | Y |
| New York | 38 | 552.80 | YES | South Dakota | 26 | 22.85 | Y |
| California | 37 | 284.51 | YES | Delaware | 25 | 32.77 | Y |
| Illinois | 37 | 598.97 | YES | Nebraska | 25 | 3.69 | Y |
| Pennsylvania | 37 | 391.76 | Colorado | 24 | 15.76 | YES | |
| Arizona | 36 | 142.33 | Minnesota | 24 | 56.92 | Y | |
| Florida | 36 | 381.17 | Y | New Mexico | 24 | 38.91 | Y |
| Vermont | 36 | 30.63 | YES | North Dakota | 23 | 0.00 | Y |
| North Carolina | 35 | 210.12 | YES | Oklahoma | 22 | 665.75 | YES |
| Oregon | 34 | 103.71 | Y | Rhode Island | 22 | 10.50 | YES |
| Maryland | 33 | 117.72 | YES | Montana | 21 | 10.38 | YES |
| Ohio | 33 | 87.20 | South Carolina | 21 | 169.00 | Y | |
| Nevada | 32 | 26.69 | Y | Indiana | 19 | 115.48 | YES |
| Connecticut | 31 | 99.73 | YES | West Virginia | 18 | 46.35 | Y |
| Missouri | 31 | 59.03 | Y | Utah | 17 | 89.59 | Y |
| Tennessee | 31 | 27.05 | Y | Virginia | 17 | 112.14 | YES |
| Michigan | 30 | 162.74 | YES | New Hampshire | 15 | 8.40 | Y |
| Washington | 30 | 25.21 | YES | Alaska | 14 | 2.86 | Y |
| District of Columbia | 29 | 14.92 | YES | Georgia | 12 | 4.63 | YES |
| Iowa | 29 | 49.69 | YES | Wyoming | 9 | 0.00 | Y |
| Kansas | 29 | 6.40 | YES | ||||
*Financial penalties include an incomplete sample ($3.57 billion, or 43%) of financial penalties from multistate settlements, i.e., only individual state settlement shares that were publicly reported in press releases over the time period. Therefore, state performance in overall settlement activity is driven by the number of settlements, not the financial penalties, attributed to each state in this table. Some states (North Dakota and Wyoming) had neither individual state shares listed in press releases nor any single-state settlements or judgments, explaining the “0” values for a few financial penalties.
** False Claims Act (FCA) as of FY 2021, as determined from the NAMFCU 2021 survey (see Detailed Methodology). YES = the FCA is Deficit Reduction Act (DRA)-compliant, with strong qui-tam provisions. Y = less strong FCA provisions in place. Note that settlements may have been finalized prior to the enactment of the state’s FCA.
Table 3, Panel B. State-Based Settlement Activity by Strength of False Claims Act, 1991-2021
| False Claims Act | Average Number of Settlements | Average Financial Penalty ($ million) | States (number) |
|---|---|---|---|
| None | 34 | 152 | AL, AZ, ID, MS, OH, PA (6) |
| Weak | 27 | 156 | AK, AR, DE, FL, KY, LA, MA, MN, MO, NB, ND, NH, NJ, NM, NV, OR, SC, SD, TN, UT, WV, WY (22) |
| Strong | 30 | 237 | CA, CO, CT, DC, GA, HI, IA, IL, IN, KA, MA, MD, MI, MT, NC, NY, OK, RI, TX, VA, VT, WA, WI (23) |
Figure 7. Number of Pharmaceutical Industry Settlements, 1991-2021: Civil vs. Criminal*

*“Civil” refers to all solely civil settlements. “Civil-Criminal” refers to settlements with both a civil and criminal financial penalty. “Criminal” refers to cases with only a criminal component. Sixty-three of 66 (95%) of the criminal and civil-criminal settlements were federal.
Figure 8. Pharmaceutical Industry Financial Penalties, 1991-2021: Civil vs. Criminal*
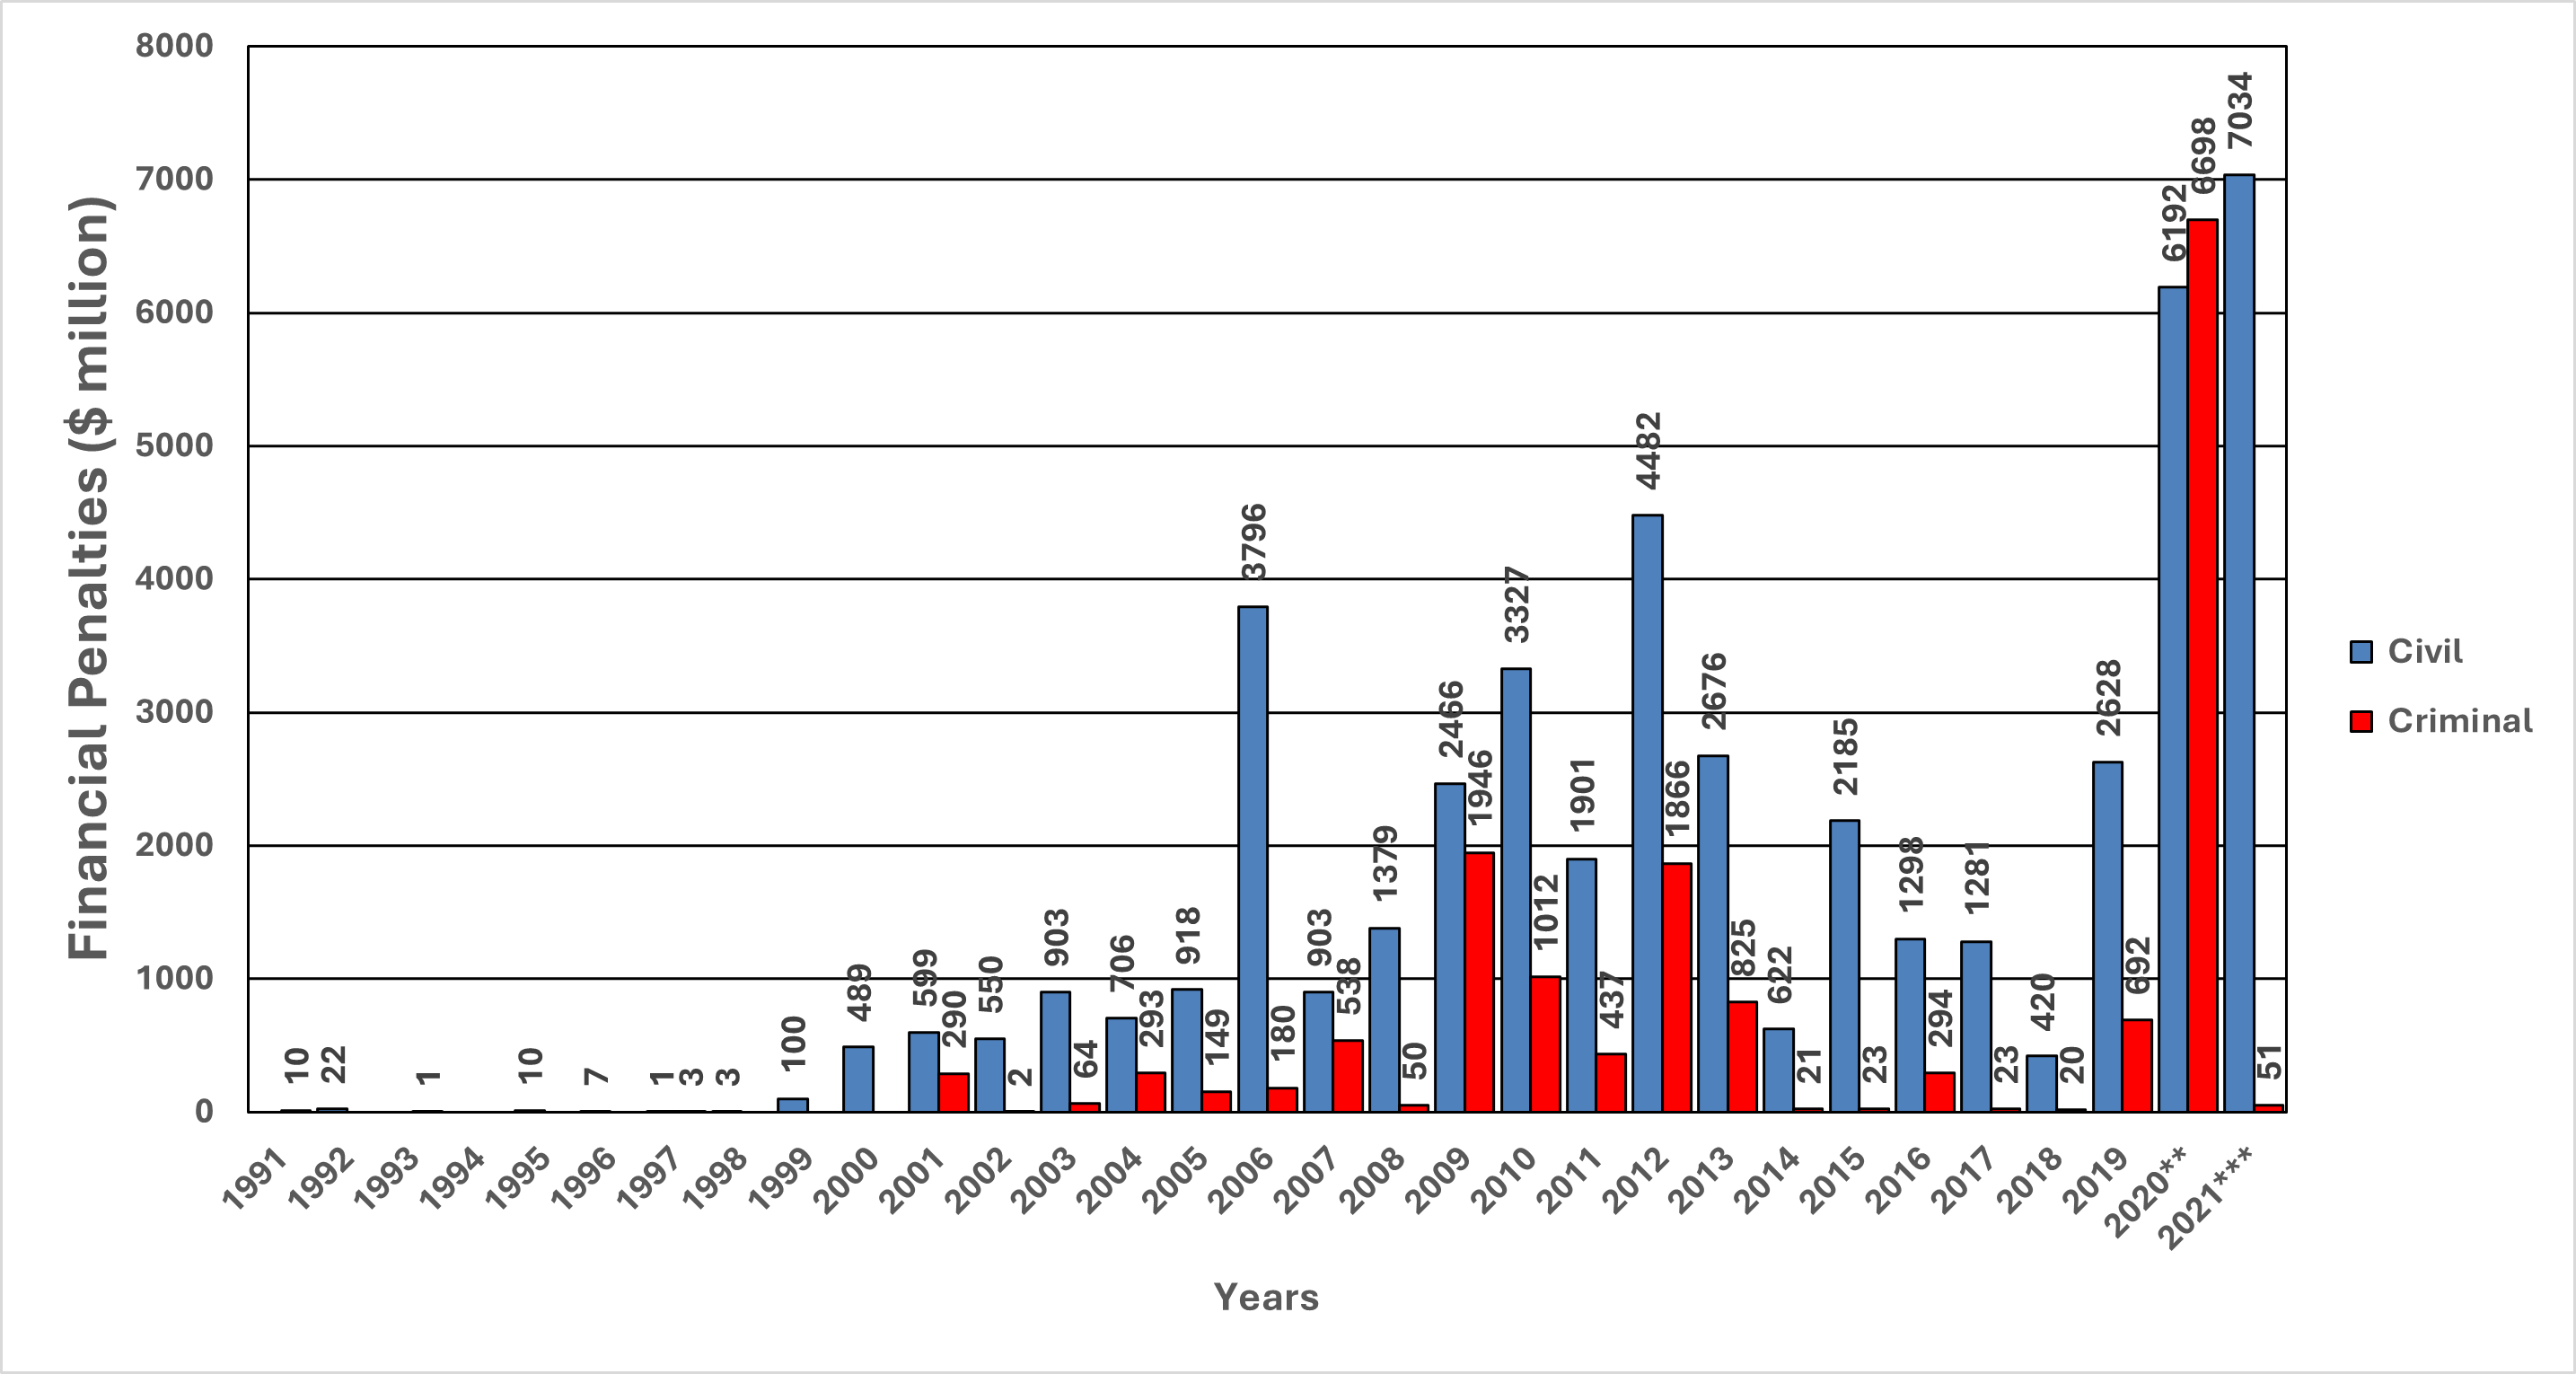
* Ninety-five percent of criminal penalties were federal. In mixed civil–criminal settlements, the civil and criminal portions were separated out and added to their corresponding categories here.
** The highest two civil settlement amounts in 2020 were for opioids: Purdue agreed to pay $2.8 billion, and Mallinckrodt agreed to pay $1.6 billion. The single highest criminal penalty for 2020 was against Purdue, the same settlement noted in the previous sentence; that penalty was $5.5 billion.
*** The single highest civil penalty agreed to in 2021 was for opioids: Johnson & Johnson, $5 billion.
Figure 9. Federal False Claims Act (FCA): Financial Penalties by Industry, Fiscal Year 1991-2021*

*Department of Defense False Claims Act settlement dollars are from this source: FRAUD STATISTICS – OVERVIEW, October 1, 1986 – September 30, 2021, Civil Division, U.S. Department of Justice, https://www.justice.gov/file/1467871/download. Accessed January 1, 2023. Pharmaceutical data is from this current Public Citizen study, and it has been adjusted to the federal fiscal year periods. The pharmaceutical data only includes cases where the federal portion of the FCA penalty was specified in the press release.
Figure 10. Federal Pharmaceutical Industry Settlements, 1991-2021: Qui Tam* (Whistleblower) vs. Non-Qui Tam

*qui tam cases are those in which any part of the settlement was triggered by a qui tam action.
Figure 11. Federal Pharmaceutical Industry Financial Penalties, 1991-2021: Qui Tam* (Whistleblower) vs. Non-Qui Tam

*Qui tam cases are those in which any part of the settlement was triggered by a qui tam action. Financial penalties in qui tam settlements presented here include all penalties, including any penalties that may not have been obtained as a direct result of a qui tam action.
**In 2020, the highest federal non-qui tam settlement was the opioid case against Purdue for $8.3 billion (89% of the total in that category-year).
Figure 12. State Pharmaceutical Industry Settlements, 1991-2021: Qui Tam* (Whistleblower) vs. Non-Qui Tam

*Qui tam cases are those in which any part of the settlement was triggered by a qui tam action.
Figure 13. State Pharmaceutical Industry Financial Penalties, 1991-2021: Qui Tam* (Whistleblower) vs. Non-Qui Tam

*Qui tam cases are those in which any part of the settlement was triggered by a qui tam action. Financial penalties in qui tam settlements presented here include all penalties, including any penalties not obtained as a direct result of a qui tam action.
**In 2019, the highest state non-qui tam settlement was $572 million (49% of total) promised by Johnson & Johnson for alleged unlawful promotion of opioids.
***In 2020, the highest state non-qui tam settlement was $1.6 billion (99% of the total) promised by Mallinckrodt for alleged unlawful promotion of opioids.
‡In 2021, the highest state non-qui tam settlement was $5 billion (81% of the total) promised by Johnson & Johnson for alleged unlawful promotion of opioids.
Table 4. Pharmaceutical Company Penalties: Worst Offenders, 1991-2021
| Company* | Total Financial Penalties ($ million) | Percent of Total** | Number of Settlements*** |
|---|---|---|---|
| Purdue | 8,990 | 14 | 6 |
| Johnson & Johnson | 8,449 | 14 | 23 |
| GlaxoSmithKline | 7,921 | 13 | 33 |
| Pfizer | 4,773 | 8 | 36 |
| Novartis | 2,948 | 5 | 25 |
| Teva | 2,326 | 4 | 22 |
| Abbott | 2,009 | 3 | 17 |
| Merck | 1,840 | 3 | 23 |
| Bristol-Myers Squibb | 1,823 | 3 | 16 |
| Mallinckrodt | 1,754 | 3 | 5 |
| Eli Lilly | 1,742 | 3 | 15 |
| Reckitt Benckiser | 1,397 | 2 | 1 |
| Schering Plough | 1,339 | 2 | 8 |
| Mylan | 1,210 | 2 | 25 |
| Indivior | 1,183 | 2 | 4 |
| AstraZeneca | 1,035 | 2 | 13 |
| Amgen | 939 | 2 | 13 |
| TAP | 895 | 1 | 2 |
| Allergan | 816 | 1 | 4 |
| Serono | 704 | 1 | 1 |
| Other**** | 8,287 | 13 | 283 |
| Total | 62,382 | 100 | 575 |
*Parent company at time of settlement. If the company is nonexistent now, the name at time of most recent settlement was used.
**Percent of $63.340 billion in overall penalties.
***Total (575) listed here is greater than the total number of settlements over the 1991-2021 time period (482) because 21 settlements involved more than one company.
‡Other companies (in order of total penalties paid): Daiichi Sankyo, Boehringer, Cephalon, Sanofi, Sandoz, Endo, Forest, Actavis, Actelion Pharmaceuticals, Bayer, Celgene, Hoffman-LaRoche, Insys, Taro, Par, United Therapeutics, Elan, King, Avanir, Astellas, Aventis, Gilead, Novo Nordisk, Aventis Animal Nutrition, Watson, Jazz, Apotex, Merck-Germany, Genentech, Roche, Lupin, Shire, Azko Nobel, UCB, Salix, Lundbeck, Fresenius, KV, BASF, CareFusion, Novelion, Vyera, Baxter, Intermune, BTG, Biovail, B. Braun, Alexion, Bausch & Lomb, DFB, AbbVie, Glenmark, Hi-Tech, Sun, Fagron, Biogen, Sun Pharmaceuticals, Pharmacia, Janssen, McNeil-PPC, US WorldMeds, SciClone, Kaleo, Incyte, Eisai, Victory, Bofar, Dava, Takeda, Cell, Royal/Seton, Hikma, Medicis, Perrigo, Upsher-Smith, Galena, Modern Wholesale Midwest, Heritage, Warner Chilcott, Barr, Dr. Reddy’s Laboratories, The Harvard Drug Group, Otsuka, AVEO, Warner-Lambert, Pacira, Rising, Cypress Pharmaceutical, Circa, Syncor, Dainippon, Ferring, Pernix, Shionogi, Wockhardt, LNK, Valeant, Collegium, Kiss, Mitsubishi Tanabe Pharma, Alpharma, Andrx, Apothecon, Ben Venue, Centocor, Chinook, Crown, Evonik Degussa GmbH, Immunex, Ivax, Lonza AG, Mitsui, Nepera, Ortho Biotech, Provectus, Purepac, Roxane, Sicor, Somitomo, Teikoku, Vertellus, Warrick.
Table 5. Pharmaceutical Company Penalties: Repeat Offenders, 1991-2021*
| Company** | Number of Federal Settlements | Total Federal Financial Penalties ($ million) | Percent of Total*** |
|---|---|---|---|
| Pfizer | 15 | 4,440 | 9.0 |
| Novartis | 12 | 2,803 | 5.7 |
| GlaxoSmithKline | 9 | 7,413 | 15.1 |
| Bristol Myers Squibb | 9 | 922 | 1.9 |
| Teva | 7 | 1,770 | 3.6 |
| Merck | 7 | 1,662 | 3.4 |
| Johnson & Johnson | 6 | 2,246 | 4.6 |
| AstraZeneca | 6 | 936 | 1.9 |
| Schering-Plough | 5 | 1,308 | 2.7 |
| Mylan | 5 | 1,042 | 2.1 |
| Sanofi | 5 | 353 | 0.7 |
| Abbott | 4 | 1,687 | 3.4 |
| Indivior | 4 | 1,183 | 2.4 |
| Amgen | 4 | 827 | 1.7 |
| Mallinckrodt | 4 | 154 | 0.3 |
| Novo Nordisk | 4 | 94 | 0.2 |
| Eli Lilly | 3 | 1,480 | 3.0 |
| Daiichi Sankyo | 3 | 539 | 1.1 |
| Sandoz | 3 | 402 | 0.8 |
| Bayer | 3 | 291 | 0.6 |
| Endo | 3 | 232 | 0.5 |
| Hoffman-La Roche | 3 | 20 | 0.0 |
| Others‡ | 38 (19 different companies; two each) | 11,292 | 22.9 |
| Total | 248 | 43,096 | 87.5 |
*Companies with at least two federal settlements from 1991-2021. State settlements were excluded from these tallies because some state settlements (which could not be consistently distinguished based on the limited information in press releases) resolved the same alleged fraudulent activities as those addressed in one or more federal settlements.
**Parent company at time of settlement. If the company is nonexistent now, the company name at time of most recent settlement was used.
***Percent of $49.2 billion in overall federal penalties; note that this includes single settlement firms.
‡Other repeat offenders, all with two federal settlements (in order of total penalties paid): Purdue, Allergan, Boehringer, Forest, Par, King, Astellas, Watson, Jazz, Apotex, Merck-Germany, UCB, KV, Novelion, Biovail, Alexion, Bofar, Eisai, Perrigo.
Table 6. Twenty Largest Settlements and Judgments, 1991-2021
| Company | Total Penalty ($ million) | Year | Violation(s)* | Major Drug Products Involved (if Applicable and Known)** | Laws Violated (if known)*** | Qui Tam‡ | Federal or State |
|---|---|---|---|---|---|---|---|
| Purdue | 8,344 | 2020 | Illegal Distribution; Kickbacks; Unlawful Promotion | oxycodone (OXYCONTIN), buprenorphine (BUTRANS), hydrocodone (HYSINGLA ER) [opioids] | FCA; FDCA | Federal | |
| Johnson & Johnson | 5,000 | 2021 | Unlawful Promotion | opioids | State | ||
| GlaxoSmith Kline | 3,400 | 2006 | Financial Violations | Federal | |||
| GlaxoSmith Kline | 3,000 | 2012 | Unlawful Promotion; Kickbacks; Concealing Data; Overcharging Govt. Health Programs | paroxetine (PAXIL), bupropion (WELLBUTRIN), fluticasone/salmeterol (ADVAIR), lamotrigine (LAMICTAL), ondansetron (ZOFRAN), sumatriptan (IMITREX), alosetron (LOTRONEX), fluticasone (FLOVENT), valacyclovir (VALTREX), rosiglitazone (AVANDIA) | FCA; FDCA | yes | Federal |
| Pfizer | 2,300 | 2009 | Unlawful Promotion; Kickbacks | Valdecoxib (BEXTRA), ziprasidone (GEODON), linezolid (ZYVOX), pregabalin (LYRICA) | FCA; FDCA | yes | Federal |
| Johnson & Johnson | 2,006 | 2013 | Unlawful Promotion; Kickbacks; Concealing Data | risperidone (RISPERDAL), paliperidone (INVEGA), nesiritide recombinant (NATRECOR) | FCA; FDCA | yes | Federal |
| Mallinckrodt | 1,600 | 2020 | Unlawful Promotion | opioids | State | ||
| Abbott | 1,500 | 2012 | Unlawful Promotion; Kickbacks; Concealing Data | divalproex (DEPAKOTE) | FCA; FDCA; Anti-Kickback Statute | yes | Federal |
| Eli Lilly | 1,415 | 2009 | Unlawful Promotion | olanzapine (ZYPREXA) | FCA; FDCA | yes | Federal |
| Reckitt Benckiser (Indivior) | 1,397 | 2019 | Unlawful Promotion; Monopoly Practices | buprenorphine/naloxone (SUBOXONE) [opioid] | FCA; Federal Trade Commission Act | yes | Federal |
| Teva | 1,200 | 2015 | Monopoly Practices | Federal Trade Commission Act | Federal | ||
| Merck | 950 | 2011 | Unlawful Promotion | rofecoxib (VIOXX) | FCA; FDCA | Federal | |
| TAP | 875 | 2001 | Overcharging Govt. Health Programs; Kickbacks | leuprolide (LUPRON) | FCA; Anti-Kickback Statute; Prescription Drug Marketing Act | yes | Federal |
| Bristol Myers Squibb and Sanofi | 834 | 2021 | Unlawful Promotion | clopidogrel (PLAVIX) | State | ||
| Pfizer (Wyeth) | 785 | 2016 | Overcharging Govt. Health Programs | pantoprazole (PROTONIX) | FCA | yes | Federal |
| Amgen | 762 | 2012 | Unlawful Promotion; Kickbacks; Overcharging Govt. Health Programs | darbepoetin (ARANESP), etanercept (ENBREL), pegfilgrastim (NEULASTA) | FCA; FDCA | yes | Federal |
| GlaxoSmith Kline | 750 | 2010 | Poor Manufacturing Practices | granisetron (KYTRIL), mupirocin (BACTROBAN), paroxetine (PAXIL), metformin/rosiglitazone (AVANDAMET) | FCA; FDCA | yes | Federal |
| Serono | 704 | 2005 | Unlawful Promotion; Kickbacks; Monopoly Practices | serostim | FCA | yes | Federal |
| Novartis | 678 | 2020 | Kickbacks | amlodipine/benazepril (LOTREL); aliskiren/valsartan (VALTURNA); nateglinide (STARLIX); aliskiren/amlodipine (TEKAMLO); hyrdochlorothiazide/valsartan (DIOVAN HCT); aliskiren/hydrochlorothiaide (TEKTURNA HCT); amlodipine/hydrochlorothiazide/ valsartan (EXFORGE HCT); amlodipine/vasartan (EXFORGE); valsartan (DIOVAN); aliskiren (TEKTURNA) | FCA | yes | Federal |
| Merck | 650 | 2008 | Overcharging Govt. Health Programs; Kickbacks | simvastatin (ZOCOR), rofecoxib (VIOXX); famotidine (PEPCID) | FCA; Medicaid Rebate Statute | yes | Federal |
* Violations include those alleged in civil settlements, as well as violations to which companies pleaded guilty in criminal settlements.
** If known from the press release; not necessarily a comprehensive list.
*** Laws allegedly violated in civil settlements, or those to which companies pleaded guilty to violating in criminal settlements, not necessarily a comprehensive list. FCA (False Claims Act); FDCA (Food, Drug, and Cosmetic Act).
‡Qui tam refers to settlements involving whistleblowers.
Table 7. Definitions of the Types of Violations by Pharmaceutical Companies
| Type of Violation | Description |
|---|---|
| Overcharging Government Health Programs | Inflating the average wholesale price of products, failing to give the lowest market price to government health programs, or failing to pay required rebates to any government health program |
| Unlawful Promotion | Off-label promotion of drug products or other deceptive marketing practices (e.g., downplaying health risks of a product); contributing to/fueling the opioid epidemic is included in this category for the years 2018-2021 |
| Monopoly Practices | Unlawfully attempting to keep monopoly patent pricing privileges on products or collusion with other companies undertaken with the purpose of increasing the market share of a particular product |
| Kickbacks | Kickbacks (e.g., monetary payments) to providers, hospitals, or other parties to influence prescribing patterns in favor of the company |
| Concealing Data | Concealing results of company-sponsored studies or other data from the federal or state governments or the general public, or falsifying data submitted to the federal government |
| Poor Manufacturing Practices | Selling drug products that fail to meet FDA standards or specifications (e.g., contaminated or adulterated products, or products that fail to meet size or dosage specifications) |
| Environmental Violations | Clean Air Act and Clean Water Act violations or failing to meet federal emissions standards |
| Financial Violations | Accounting, tax, or investor fraud, or insider trading |
| Illegal Distribution | Distributing an unapproved pharmaceutical product or illegally distributing an approved pharmaceutical product (such as failing to monitor suspicious purchases of dangerous drugs, including opioids) |
Figure 14. Types of Pharmaceutical Industry Violations, 1991-2021*

*Total number of violations (545) exceeds number of settlements (482) as some settlements involved more than one type of violation.
**The single discrimination-related violation settlement occurred in 2021: LNK International for $200,000.
Figure 15. Number of Pharmaceutical Industry Settlements Involving Overcharging of Government Health Programs, 1991-2021

Figure 16. Pharmaceutical Industry Financial Penalties by Type of Violation, 1991-2021 ($ million)

* Settlements that involved more than one type of violation were reviewed and, where possible, individual penalties for each type of violation were determined and added to the totals for that violation. The final total for “multiple violations” represents the sum total that could not be attributed to a single violation.
Figure 17. Pharmaceutical Industry Financial Penalties for Unlawful Promotion, 1991-2021
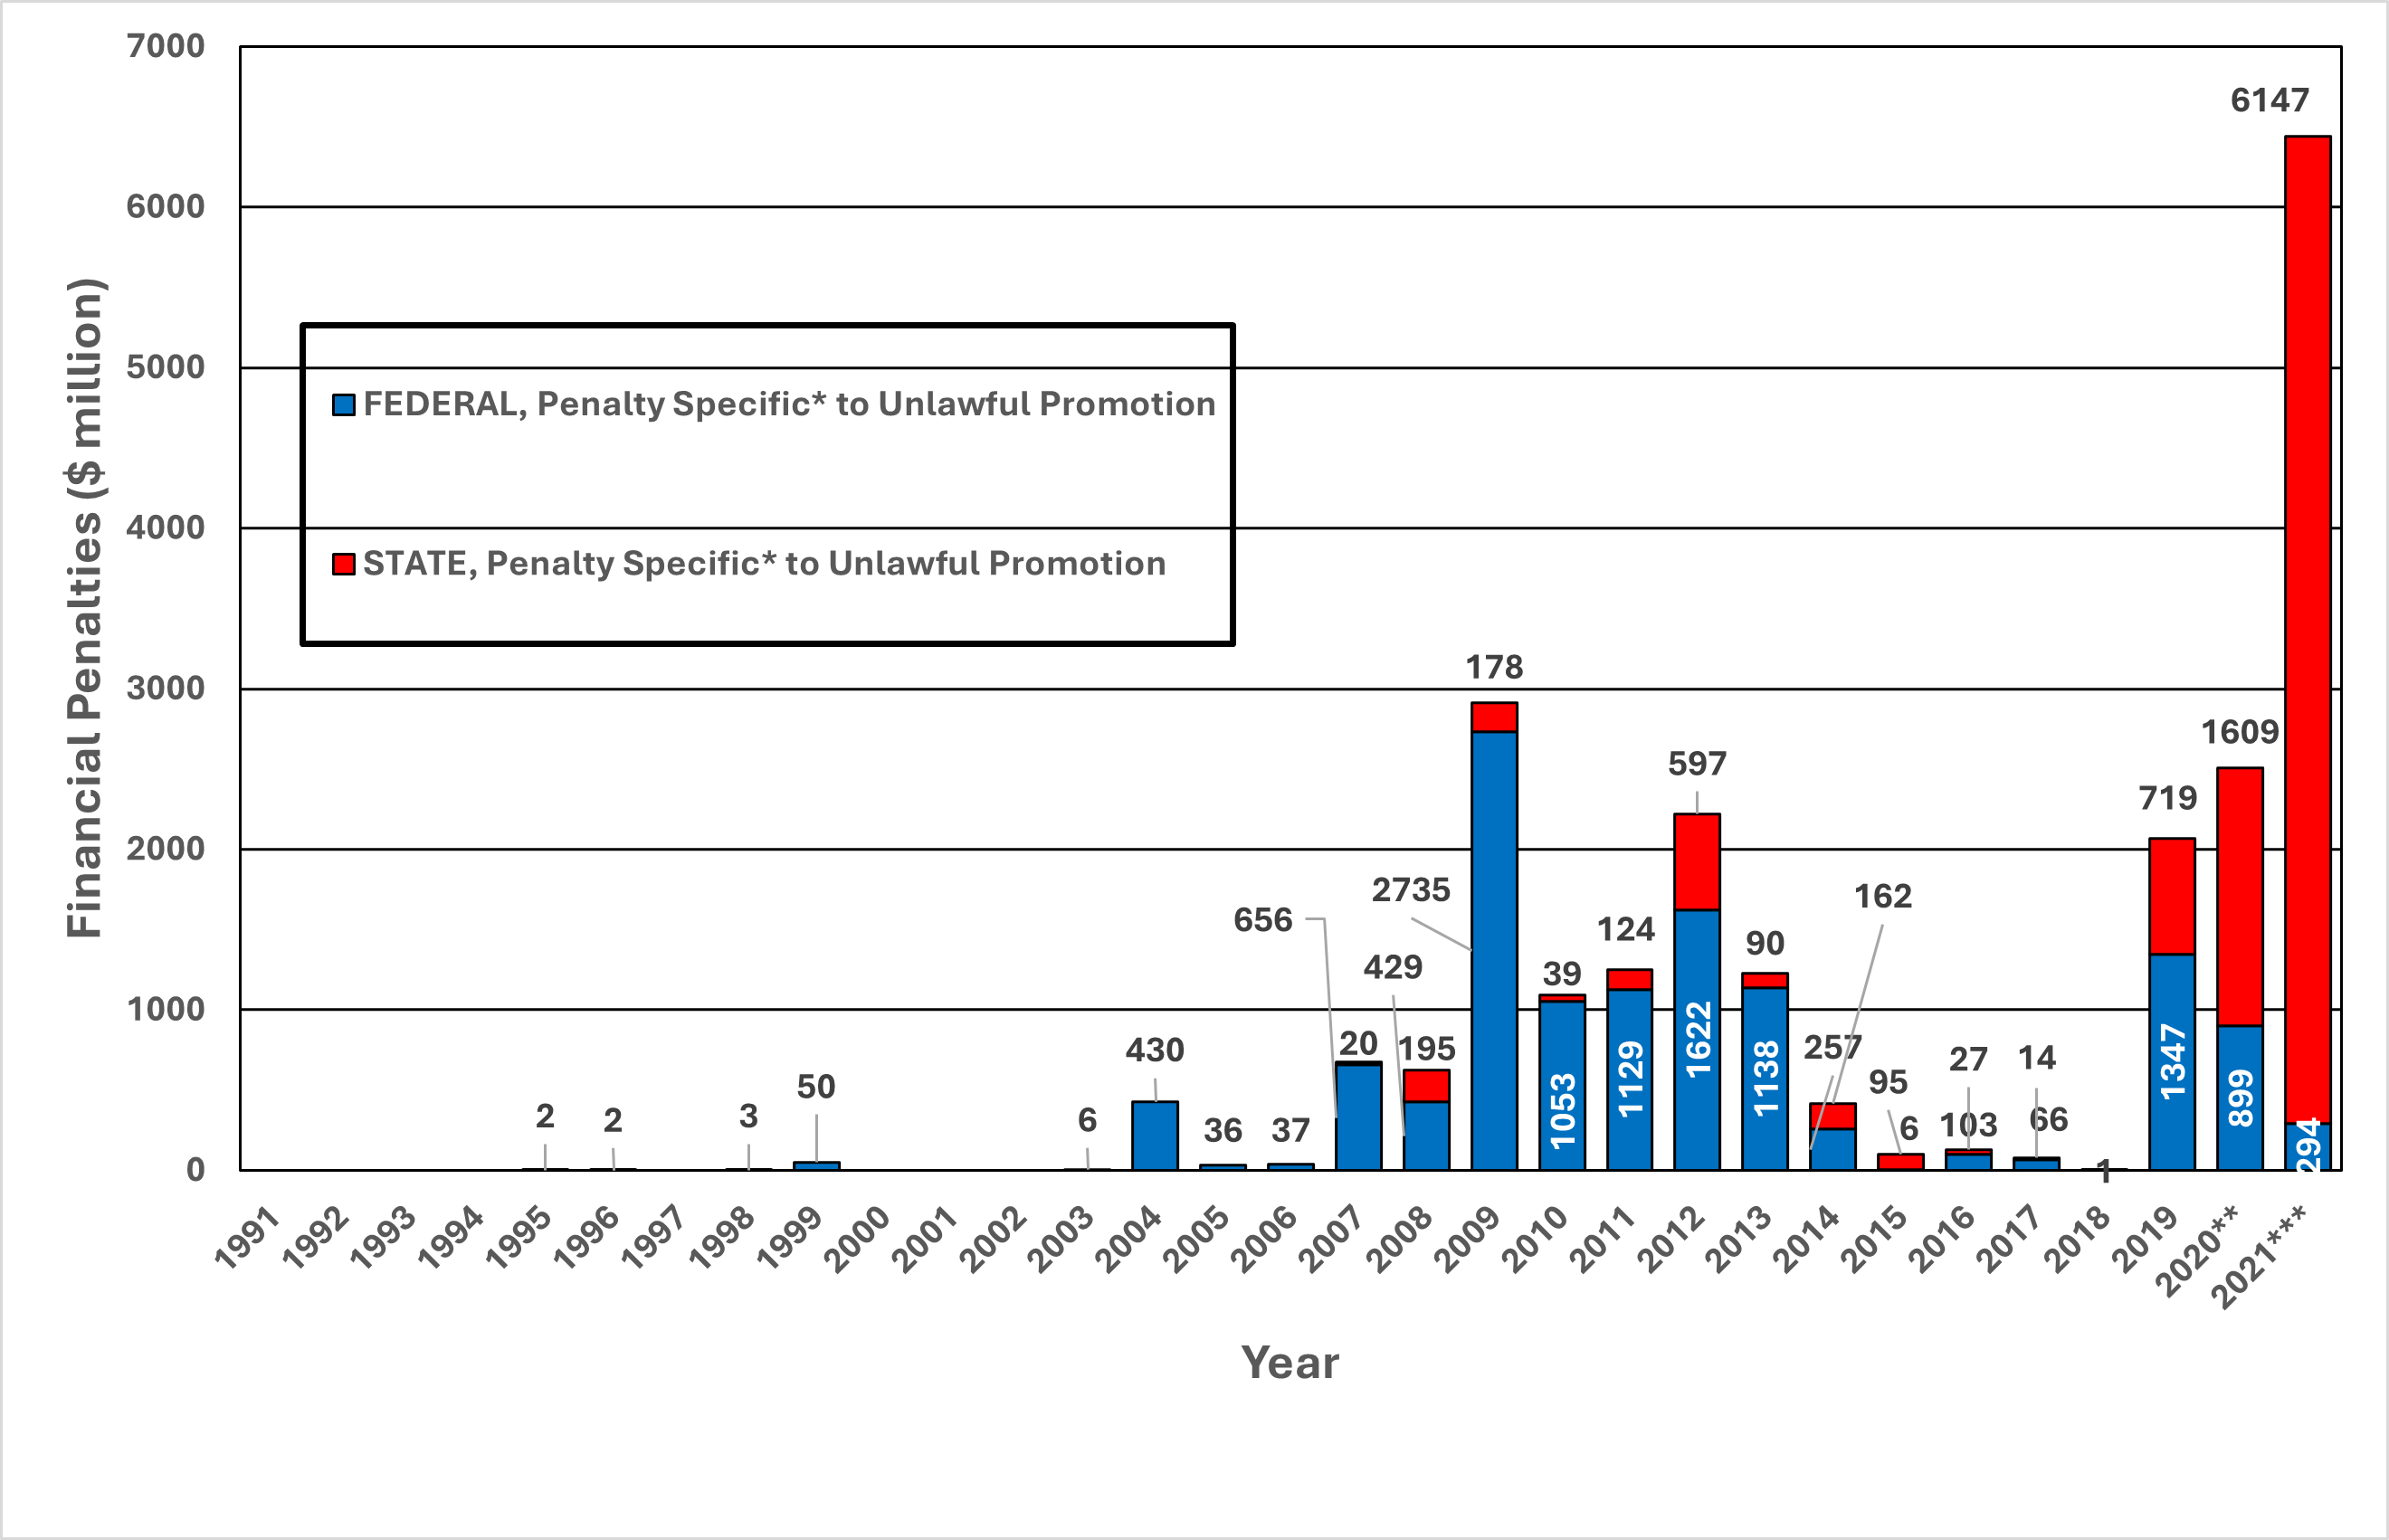
*The numbers in this chart are for state (top, red bars) or federal (bottom, blue bars) penalties promised by settlements in each year where “unlawful promotion” was the only (specific) charge. Accordingly, the amounts represented here are a subset of the equal or larger amounts represented in Figure 18, which includes settlements where Unlawful Promotion was the allegation, with or without other allegations.
**In 2020, the two largest penalties tied directly to unlawful promotion were both for opioids against Mallinckrodt ($1.6 million, multistate) and Indivior ($599 million, federal).
***In 2021, the single largest penalty specific to unlawful promotion was with Johnson & Johnson for opioids ($5 billion, multistate).
Figure 18. Pharmaceutical Industry Financial Penalties for Settlements Involving* Unlawful Promotion, 1991-2021

*The numbers in this chart are for state (top, red bars) or federal (bottom, blue bars) penalties promised by settlements in each year for violations where at least one of the violations evident in the press release was “unlawful promotion”. Those settlements where unlawful promotion was the only violation are included here, and thus the numbers here completely overlap with those presented in Figure 17; they are either the same or larger than those numbers.
**In 2020, the single largest penalty related to unlawful promotion was with Purdue for opioids, ($8.3 billion, federal).
***In 2021, the single largest state penalty specific to unlawful promotion was with Johnson & Johnson for opioids ($5 billion).
Detailed Methodology
Inclusion and exclusion criteria
As with the previous reports, only settlements involving companies that were pharmaceutical manufacturers (e.g., not pharmacy chains or distributors or medical device manufacturers) were included. Cases were excluded if the wrongdoing concerned a product that was not a pharmaceutical (e.g., medical devices were excluded; intravenous solutions, on the other hand, were considered pharmaceuticals). If a release mentioned a singular “settlement,” regardless of how many companies or states were involved, it was counted as one settlement in our database. If a release mentioned the plural “settlements” and there was a breakdown of amount paid by company, then each company’s settlement was counted as a separate case.
Note that since the 2016 iteration of this report, all settlements were included regardless of the magnitude of the financial penalty. However, for the time period prior to July 19, 2012, only settlements of $1 million or greater were included. We changed our methodology beginning with the 2016 report to include settlements of less than $1 million, primarily to ensure that totals for smaller states (which are more likely to have smaller settlements) are not underrepresented. In a few cases, $0 settlements were included if the penalties were only behavioral injunctions absent financial payouts or if the payouts were not disclosed in the press release.
Data sources
For federal cases, the following sources were accessed: 1) the Department of Justice (DOJ) website,[62] 2) the Securities and Exchange Commission (SEC) website,[63] 3) the Project on Government Oversight’s (POGO’s) Federal Contractor Misconduct Database,[64] and, for the third time, a fourth data source: the FCPA Professor blog (for settlements involving violations or alleged violations of the Foreign Corrupt Practices Act).[65] Press releases from the DOJ website were found by going to the “Justice News” section of the website. Almost all federal settlements were found in DOJ press releases. (In a few cases, federal settlements were found during searches of state attorney general websites, with no corresponding federal agency press release located.) To search the SEC website, the link to “Press Releases” was used. In POGO’s Federal Contractor Misconduct Database, the “Misconduct Filter” was used to access all settlements involving the Department of Health and Human Services as the contracting party. In addition, for the updated comparison of annual federal False Claims Act payouts by the defense and pharmaceutical industries (Figure 9), data on financial penalties recovered by the Department of Defense through FY 2021 were obtained online from DOJ.[66]
State cases were found through a search of press releases from attorney general websites for all 50 states and the District of Columbia. For websites that did not display press releases during part or all of the relevant time period (2018-2021), the website www.archive.org was accessed to recover past releases, searching for the most current URL (or a variant) for the state attorney general website (explained in detail in the 2010 report). This search strategy appeared sensitive to available state-level data except for Florida’s 2018 information.
Criminal vs. civil settlements
Criminal settlements, or criminal components of civil-criminal settlements, were defined as those in which there was a financial penalty labeled as a “criminal” fine for violation of a law or for which a penalty was ordered to be paid as part of a plea agreement or deferred-prosecution agreement. All other financial penalties were defined as civil. Civil-criminal settlements were defined as those containing both civil and criminal financial penalties.
The False Claims Act, including qui tam provisions, and the Food, Drug, and Cosmetic Act
The False Claims Act (FCA) is a commonly used legal tool to prosecute fraud against the government. Originally enacted in 1863 during the Civil War to combat defense contractor fraud, the FCA has been strengthened through various amendments beginning in 1986.[67] These amendments included protection of whistleblowers from employer retaliation and increased financial rewards for coming forward.[68] The qui tam (whistleblower) provisions are a key part of the act, allowing private citizens to bring to light illegal activities that may spur prosecution of the offending companies. The 2005 Deficit Reduction Act (DRA) rewarded states that enacted FCAs with strong qui tam provisions and civil penalties with a 10% increase in financial recoveries resulting from an investigation pursued under the state FCA.[69] As of FY 2021, 20 states had FCAs that were DRA-compliant, and 25 other states have less stringent FCA laws (Table 2).[70]
The Food, Drug, and Cosmetic Act (FDCA) is the other major federal law used to prosecute illegal pharmaceutical industry behavior. The FDCA, enacted in 1938 and since amended, forms the basis for the regulation of pharmaceuticals, including the prohibition of making false therapeutic claims about a product, such as those made regarding unapproved uses (i.e., off-label promotion).[71] Violations of the FDCA by pharmaceutical companies have typically resulted in criminal penalties. Other federal laws cited to prosecute pharmaceutical companies include the Anti-Kickback Statute, the Foreign Corrupt Practices Act, and the Clean Air Act.
Qui tam cases were typically brought under federal or state FCAs. Settlements classified as qui tam cases were those in which there was any mention in the press release of a qui tam provision being invoked or of a whistleblower being responsible for triggering any part of the investigation.
Company totals
We obtained total settlement amounts by company by reviewing the amount paid by each company in each settlement. For some settlements involving multiple companies, the dollar amount paid by each company could not be determined. These cases (representing less than 2% of all financial penalties from 1991-2021) were therefore excluded or placed into an “other firm” category when calculating total financial penalties by company. Settlements were recorded in the database under each company’s parent company at the time of the final settlement. If a settlement was announced after the offending company had been acquired by, or had merged with, another company, then the settlement was attributed to the new parent company, regardless of when the alleged violations took place. When presenting company totals, we used the most current parent company names; for companies that do not currently exist independently, we used the parent company’s name at the time of the most recent settlement. If a company spun off from another and then settled (e.g., Indivior from Reckitt Benckiser), then the spin-off company was named in our tallies.
Violation types
Violations were classified into nine general categories: concealing data, environmental violations, financial violations, illegal distribution, kickbacks, monopoly practices, overcharging government health programs, poor manufacturing practices, and unlawful promotion. Table 7 defines each category. For the 2021 report, fueling the opioid epidemic was generally classified as unlawful promotion, although it sometimes often involved charges of kickbacks, concealing data, and illegal distribution (and those allegations were coded if the press release referred to them).
Federal and state settlements
State settlements refer to those in which the federal government neither was involved in the investigation responsible for the settlement nor was a party to the final settlement, as determined through a review of the press release and, when available, the official settlement document. All other cases were classified as federal, including joint federal–state actions.
All state settlements were reviewed to classify the cases as single-state or multistate settlements. Single-state settlements were those in which only one state was a party to the final settlement, as gleaned from the information provided in the press release. All other state settlements were classified as multistate.
Single-state settlements
Complete data on financial penalties attributable to individual states were available for single-state settlements but not for multistate settlements. Therefore, two analyses were possible for the single-state settlement data: financial recoveries as a proportion of state Medicaid prescription drug expenditures and a return-on-investment (ROI) analysis (Table 1). The denominators (Medicaid prescription drug expenditures and Medicaid Fraud Control Unit [MFCU] budgets for the expenditure and ROI analyses, respectively) represent combined federal and state totals. The federal government has historically funded Medicaid prescription drug expenditures at approximately the same proportion of each state Medicaid program’s Federal Medical Assistance Percentage (FMAP),[72] and it shoulders 75% of the costs of every state’s MFCU, with the states funding the remaining 25%.[73]
For the first analysis, annual Medicaid prescription drug expenditures were obtained from the Centers for Medicare and Medicaid Services for all 50 states and the District of Columbia.[74] The sum of all prescription drug expenditures from FY 2001 (corresponding to the fiscal year of the earliest single-state settlement) through FY 2022 was used as the denominator, with total single-state financial penalties from calendar year (CY) 2000 (all of which occurred in FY 2001) through CY 2021 as the numerator. States were ranked in Table 1 by the total recoveries per $1,000 of Medicaid prescription drug expenditures.
In the second analysis, ROI values in Table 1 represent the financial return from single-state settlements relative to each state’s Medicaid fraud enforcement expenses. It was assumed that each state’s MFCU was the primary agency responsible for investigating pharmaceutical fraud.[75] MFCU annual budgetary data were obtained from annual state surveys by the National Association of Medicaid Fraud Control Units.[76] The sum of all state MFCU budgets from FY 2006 (the earliest year for which data were available) through FY 2022 (the most recent data available) was used as the denominator, with total single-state financial penalties from CYs 2000 (the year of the earliest single-state settlements) through CY 2021 (the most recent CY summarized in this report) as the numerator. All single-state settlement financial recoveries were obtained during or after FY 2006, with only three exceptions (one settlement in California for $85 million in 2000 and two for $2.5 million each in New York and Connecticut in 2004 and 2005, respectively). Because the total MFCU budget, rather than the portion devoted to prosecuting pharmaceutical fraud, was used as the denominator (potentially underestimating true ROIs), while the financial penalties used for the numerator represent both federal and state settlement shares (potentially overestimating true ROIs), the ROIs presented here are merely approximations of states’ efficiency in pursuing pharmaceutical fraud.
A third, descriptive analysis was undertaken to determine whether there exists a rough association between the number of— and financial penalties resulting from— single-state settlements and the presence of a state FCA (as of 2021). A similar analysis also was performed that was limited to those states with FCAs meeting higher federal standards (e.g., those with strong whistleblower provisions) as defined by the 2005 DRA (referred to in this report as DRA-compliant FCAs).[77] As state FCA status was based on 2021 FCA data, in some cases, single-state settlements attributed to states with an FCA may have, in fact, preceded the enactment of an FCA in those states. Thus, this analysis may be underestimating the proportion of states that finalized settlements without an FCA. In addition, even in states with an FCA as of 2021, other state laws may have been invoked to prosecute Medicaid fraud by pharmaceutical manufacturers.
A note on Medicaid prescription drug expenditure data
Medicaid drug expenditures for fiscal years were obtained from the Centers for Medicare and Medicaid Services.[78] Expenditures for all years represent only those made by the fee-for-service segment of state Medicaid programs and exclude rebates given to Medicaid Managed Care Organizations (MCOs). In addition, expenditures for FYs 2010-2015 exclude the increased prescription drug rebates to Medicaid programs mandated by the Affordable Care Act (ACA), as the entirety of these rebates was remitted to the federal government.
These two categories of data were excluded for the following reasons after discussions with an official from the Centers for Medicare and Medicaid Services:[79]
1) The two rows containing MCO rebate amounts reflect not only rebates for drugs but also rebates for other expenditure categories in the managed care plans. Therefore, including these rebates would overly deflate the net expenditure totals.
2) The increased ACA offset rows contain additional rebates mandated by the ACA but paid entirely to the federal government. Therefore, since pharmaceutical settlement penalties are split between the federal and state governments roughly according to the federal/state Medicaid funding split (i.e., the FMAP), we restricted our prescription drug expenditures and rebates to those categories (i.e., Drug Rebate Offset — National and State) that are, similarly, split roughly along the federal/state FMAP allocations.
Multistate and overall (multi- and single-state combined) settlements
The number of multistate settlements and accompanying financial penalties was determined through a search of every state’s attorney general website for press releases from each state involved in a multistate settlement. A complete list of participating states was not found for four of the 40 multistate settlements (including the two that were settled in 2018-2021). Therefore, the final settlement tallies for some states in Tables 2 and 3 are underestimates.
In addition, the financial penalties from multistate settlements presented in this report are certainly underestimates, as many states did not always specify their financial share of the settlement amounts. Only 43% of the approximately $8.3 billion in multistate settlement dollars were allocated to individual states in the press-releases review. Therefore, for both the multistate and overall state settlement tables (Tables 2 and 3, respectively), states were ranked by the number of settlements in which they participated, rather than the financial return from those settlements.
Suggested report citation:
Abrams MT, Wolfe SM. Thirty-one years of pharmaceutical industry criminal and civil penalties: 1991-2021. May 21, 2024. Public Citizen, Washington, D.C. Available at: www.citizen.org.
References
[1] Public Citizen. Rapidly increasing criminal and civil monetary penalties against the pharmaceutical industry: 1991 to 2010. December 16, 2010. https://www.citizen.org/article/rapidly-increasing-criminal-and-civil-monetary-penalties-against-the-pharmaceutical-industry-1991-to-2010/. Accessed March 5, 2024.
[2] Public Citizen. Pharmaceutical industry criminal and civil penalties: an update. September 27, 2012. https://www.citizen.org/our-work/health-and-safety/pharmaceutical-industry-criminal-and-civil-penalties-update. Accessed March 5, 2024.
[3] Public Citizen. Twenty-five years of pharmaceutical industry criminal and civil penalties: 1991 through 2015. March 31, 2016. https://www.citizen.org/our-work/health-and-safety/twenty-five-years-pharmaceutical-industry-criminal-and-civil-penalties-1991-through-2015. Accessed March 5, 2024.
[4] Public Citizen. Twenty-seven years of pharmaceutical industry criminal and civil penalties: 1991 through 2017. March 14, 2018. https://www.citizen.org/wp-content/uploads/2408.pdf. Accessed March 5, 2024.
[5] The District of Columbia is considered like a state for the purposes of this report.
[6] Department of the Attorney General of Hawai’i. Press release: “$834 million order entered in Hawai’i state court against Bristol-Myers Squibb and Sanofi for failing to investigate and disclose effectiveness of Plavix.” February 15, 2021. https://ag.Hawai’i.gov/wp-content/uploads/2021/02/News-Release-2021-13.pdf. Accessed March 6, 2024.
[7] Ledley FD, McCoy SS, Vaughan G, Cleary EG. Profitability of large pharmaceutical companies compared with other large public companies. JAMA. 2020;323(9):834-843.
[8] Public Citizen. Rapidly increasing criminal and civil monetary penalties against the pharmaceutical industry: 1991 to 2010. December 16, 2010. https://www.citizen.org/article/rapidly-increasing-criminal-and-civil-monetary-penalties-against-the-pharmaceutical-industry-1991-to-2010/. Accessed March 5, 2024.
[9] Public Citizen. Pharmaceutical industry criminal and civil penalties: an update. September 27, 2012. https://www.citizen.org/our-work/health-and-safety/pharmaceutical-industry-criminal-and-civil-penalties-update. Accessed March 5, 2024.
[10] Public Citizen. Twenty-five years of pharmaceutical industry criminal and civil penalties: 1991 through 2015. March 31, 2016. https://www.citizen.org/our-work/health-and-safety/twenty-five-years-pharmaceutical-industry-criminal-and-civil-penalties-1991-through-2015. Accessed March 5, 2024.
[11] Public Citizen. Twenty-seven years of pharmaceutical industry criminal and civil penalties: 1991 through 2017. March 14, 2018. https://www.citizen.org/wp-content/uploads/2408.pdf. Accessed March 5, 2024.
[12] U.S. Department of Justice. Press release: Opioid manufacturer Purdue Pharma pleads guilty to fraud and kickback conspiracies. November 24, 2020. https://www.justice.gov/opa/pr/opioid-manufacturer-purdue-pharma-pleads-guilty-fraud-and-kickback-conspiracies. Accessed March 7, 2024.
[13] Mann B. Federal judge approves landmark $8.3 billion Purdue Pharma opioid settlement. NPR. November 17, 2020. https://www.npr.org/2020/11/17/936022386/federal-judge-approves-landmark-8-3-billion-purdue-pharma-opioid-settlement. Accessed March 7, 2024.
[14] Ovalle D. Appeals court paves way for Purdue Pharma opioids settlement. The Washington Post. May 30, 2023. https://www.washingtonpost.com/health/2023/05/30/opioids-court-ruling-purdue-pharma-sackler-family/. Accessed March 7, 2024.
[15] Van Sickle A, Hoffman J. What to know about the Purdue Pharma case before the Supreme Court. The New York Times. December 4, 2023.
[16] U.S. Department of Justice. Press release: Indivior Solutions pleads guilty to felony charge and Indivior entities agree to pay $600 million to resolve criminal and civil investigation as part of DOJ’s largest opioid resolution. July 24, 2020. https://www.justice.gov/opa/pr/indivior-solutions-pleads-guilty-felony-charge-and-indivior-entities-agree-pay-600-million. Accessed March 7, 2024.
[17] U.S. Department of Justice. Press release: Indivior Solutions sentenced to pay $289 million in criminal penalties for unlawful marketing of opioid drugs. November 12, 2020. https://www.justice.gov/opa/pr/indivior-solutions-sentenced-pay-289-million-criminal-penalties-unlawful-marketing-opioid. Accessed March 7, 2024.
[18] Attorney General of New York. Press Release: Attorney General James announces proposed $26 billion global agreement with opioid distributors/manufacturer. July 21, 2021. https://ag.ny.gov/press-release/2021/attorney-general-james-announces-proposed-26-billion-global-agreement-opioid. Accessed March 7, 2024.
[19] Illinois Attorney General. Press release: Madigan: $135 million settlement to benefit state of Illinois. January 10, 2019. https://cookcountyrecord.com/stories/511723093-illinois-attorney-general-madigan-135-million-settlement-to-benefit-state-of-illinois. Accessed May 6, 2024.
[20] Hawai’i Department of the Attorney General. Press release: $834 million ordered entered in Hawai’i state court against Bristol-Myers Squibb and Sanofi for failing to investigate and disclose effectiveness of Plavix. February 15, 2021. https://ag.Hawai’i.gov/wp-content/uploads/2021/02/News-Release-2021-13.pdf. Accessed March 7, 2024.
[21] Erstad W. Civil law vs. criminal law: breaking down the difference. March 21, 2022. https://www.rasmussen.edu/degrees/justice-studies/blog/civil-law-versus-criminal-law/. Accessed March 8, 2024.
[22] American Bar Association. How courts work. September 9, 2019. https://www.americanbar.org/groups/public_education/resources/law_related_education_network/how_courts_work/cases/. Accessed March 15, 2024.
[23] United States Courts. Criminal Cases. https://www.uscourts.gov/about-federal-courts/types-cases/criminal-cases. Accessed March 15, 2024.
[24] U.S. Department of Justice. Press release: Opioid manufacturer Purdue Pharma pleads guilty to fraud and kickback conspiracies. November 24, 2020. https://www.justice.gov/opa/pr/opioid-manufacturer-purdue-pharma-pleads-guilty-fraud-and-kickback-conspiracies. Accessed March 8, 2024.
[25] Fritze J. These two moms lost sons to opioids. Now they’re on opposite sides at the Supreme Court. USA Today. October 16, 2023.
[26] Cole D, de Vogue A. Supreme court blocks $6 billion opioid settlement that would have given Sackler family immunity. August 10, 2023. https://www.cnn.com/2023/08/10/politics/supreme-court-purdue-pharma-opioid-settlement/index.html. Accessed March 8, 2024.
[27] Purdue. Restructure. Purdue Pharma bankrupcy. Undated. https://www.purduepharma.com/restructure/. Accessed March 8, 2024.
[28] U.S. Department of Justice. Press release: Indivior Solutions pleads guilty to felony charge and Indivior Entities agree to pay $600 Million to resolve criminal and civil investigations as part of DOJ’s largest opioid resolution. July 24, 2020. https://www.justice.gov/opa/pr/indivior-solutions-pleads-guilty-felony-charge-and-indivior-entities-agree-pay-600-million. Accessed March 8, 2024.
[29] Attorney General State of Arizona. Press release: AG Brnovich announces former CEO of Insys will pay $2 million for role in opioid scheme. June 30, 2020. https://www.azag.gov/press-release/ag-brnovich-announces-former-ceo-insys-will-pay-2-million-role-opioid-scheme. Accessed March 8, 2024.
[30] U.S. Department of Justice. Press release: Former generic pharmaceutical executive pleads guilty for role in criminal antitrust conspiracy. February 14, 2020. https://www.justice.gov/opa/pr/former-generic-pharmaceutical-executive-pleads-guilty-role-criminal-antitrust-conspiracy. Accessed March 15, 2024.
[31] U.S. Department of Justice. Press release: Generic pharmaceutical company admits to fixing price of widely used cholesterol medication. May 7, 2020. https://www.justice.gov/opa/pr/generic-pharmaceutical-company-admits-fixing-price-widely-used-cholesterol-medication. Accessed March 8, 2024.
[32] U.S. Department of Justice. Press release: Novartis Hellas S.A.C.I. and Alcon Pte Ltd agree to pay over $233 million combined to resolve criminal FCPA cases. June 25, 2020. https://www.justice.gov/opa/pr/novartis-hellas-saci-and-alcon-pte-ltd-agree-pay-over-233-million-combined-resolve-criminal. Accessed March 8, 2024.
[33] FCPA Professor. Alexion Pharmaceuticals resolves $21.5 million enforcement action. July 3, 2020. https://fcpaprofessor.com/alexion-pharmaceuticals-resolves-21-5-million-enforcement-action/#more-29388. Accessed March 8, 2024.
[34] U.S. Department of Justice. Press release: Former medical director of Suboxone manufacturer Indivior sentenced in connection with drug safety claims. December 17, 2020. https://www.justice.gov/opa/pr/former-medical-director-suboxone-manufacturer-indivior-sentenced-connection-drug-safety. Accessed March 8, 2024.
[35] Emanuel G, Romo V. Pharmaceutical executive John Kapoor sentenced to 66 months in prison in opioid trial. Morning Edition. January 23, 2020. https://www.npr.org/2020/01/23/798973304/pharmaceutical-executive-john-kapoor-sentenced-to-66-months-in-prison-in-opioid. Accessed March 8, 2024.
[36] U.S. Department of Justice. The False Claims Act. April 4, 2023. https://www.justice.gov/civil/false-claims-act. Accessed March 8, 2024.
[37] U.S. Department of Justice. Press release: Justice department recovers over $2.2 billion from False Claims Act cases in fiscal year 2020. January 14, 2021. https://www.justice.gov/opa/pr/justice-department-recovers-over-22-billion-false-claims-act-cases-fiscal-year-2020. Accessed March 8, 2024.
[38] Ibid.
[39] Ibid.
[40] U.S. Department of Justice. Novartis pays over $642 million to settle allegations of improper payments to
patients and physicians. July 1, 2020. https://www.justice.gov/opa/pr/novartis-pays-over-642-million-settle-allegations-improper-payments-patients-and-physicians. Accessed March 11, 2024.
[41] Office of the Indiana Attorney General. Press release: AG Hill announces $678M national settlement with Novartis Pharmaceuticals over alleged kickbacks. September 21, 2020. https://events.in.gov/event/ag-hill-announces-678m-national-settlement-with-novartis-pharmaceuticals-over-alleged-kickbacks?utm_campaign=widget&utm_medium=widget&utm_source=State+of+Indiana. Accessed March 11, 2024.
[42] Statistica. Total number of pharmaceutical companies with active R&D pipelines worldwide from 2001 to 2023. https://www.statista.com/statistics/791340/pharmaceutical-companies-number-with-active-pipeline/. Accessed March 20, 2024.
[43] Office of Public Affairs. U.S. Department of Justice. Press release: Opioid manufacturer Purdue Pharma pleads guilty to fraud and kickback conspiracies. November 24, 2020. https://www.justice.gov/opa/pr/opioid-manufacturer-purdue-pharma-pleads-guilty-fraud-and-kickback-conspiracies. Accessed March 11, 2024.
[44] The Office of Minnesota Attorney General Keith Ellison. State, cities, counties reach historic agreement on allocating opioid settlement funds. December 6, 2021. https://www.ag.state.mn.us/Office/Communications/2021/12/06_OpioidSettlement.asp. Accessed March 11, 2024.
[45] Public Citizen. Twenty-seven years of pharmaceutical industry criminal and civil penalties: 1991 through 2017. March 14, 2018. https://www.citizen.org/wp-content/uploads/2408.pdf. Accessed March 11, 2024.
[46] U.S. Center for Disease Control and Prevention. Understanding the opioid overdose epidemic. August 8, 2023. https://www.cdc.gov/opioids/basics/epidemic.html. Accessed November 10, 2023.
[47] Justice News. U.S. Department of Justice. Remarks as prepared for delivery: Attorney General William P. Barr delivers remarks at the Department of Justice’s 2020 National Opioid Summit Washington, DC. March 6, 2020.
[48] Benner K. Purdue Pharma pleads guilty to role in opioid crisis as part of deal with Justice Dept. The New York Times. July 20, 2021.
[49] Department of the Attorney General in Hawai’i. February 15, 2021. https://ag.hawaii.gov/wp-content/uploads/2021/02/News-Release-2021-13.pdf. Accessed May 17, 2022.
[50] Press release: Attorney General Raoul announces $242 million settlement to benefit state of Illinois. October 28, 2019. https://illinoisattorneygeneral.gov/dA/765600a3dc/201910-28%20242%20MILLION%20SETTLEMENT%20TO%20BENEFIT%20STATE%20OF%20ILLINOIS.pdf. Accessed May 13, 2024.
[51] Press release: Madigan: $135 million settlement to benefit state of Illinois. https://cookcountyrecord.com/stories/511723093-illinois-attorney-general-madigan-135-million-settlement-to-benefit-state-of-illinois. Accessed May 13, 2024.
[52] Public Citizen. Twenty-seven years of pharmaceutical industry criminal and civil penalties: 1991 through 2017. March 14, 2018. https://www.citizen.org/wp-content/uploads/2408.pdf. Accessed March 5, 2024.
[53] U.S. Department of Justice. Press release: Justice Department recovers over $3 billion from False Claims Act cases in fiscal year 2019. January 9, 2020. https://www.justice.gov/opa/pr/justice-department-recovers-over-3-billion-false-claims-act-cases-fiscal-year-2019. Accessed March 12, 2024.
[54] U.S. Department of Justice. Press release: Justice Department recovers over $2.2 billion from False Claims Act cases in fiscal year 2020. January 14, 2021. https://www.justice.gov/opa/pr/justice-department-recovers-over-22-billion-false-claims-act-cases-fiscal-year-2020. Accessed March 12, 2024.
[55] Daval CJR, Avorn J, Kesselheim AS. Holding pharmaceutical and medical device executives accountable as responsible corporate officers. JAMA Intern Med. 2022;182(11):1199-1205.
[56] Ibid.
[57] Claypool R. Corporate prosecution doldrums. Public Citizen. October 30, 2023. https://www.citizen.org/article/corporate-crime-prosecution-doldrums-low-2022/. Accessed March 12, 2024.
[58] Ibid.
[59] Van Sickle A, Hoffman J. What to know about the Purdue Pharma case before the Supreme Court. The New York Times. December 4, 2023.
[60] Haffajee RL. The Public Health Value of Opioid Litigation. J Law Med Ethics. 2020;48(2):279-292.
[61] Bogdanich W and Forsythe M. When McKinsey comes to town. New York, Doubleday: 2022.
[62] Department of Justice, Office of Public Affairs. Justice News. http://www.justice.gov/justice-news. Accessed May 5, 2021.
[63] Securities and Exchange Commission. Press Releases. http://www.sec.gov/news/press.shtml. Accessed May 18, 2022.
[64] Project on Government Oversight. Federal Contractor Misconduct Database. http://www.contractormisconduct.org/misconduct. Accessed April 1, 2022.
[65] FCPA Professor. Section on pharmaceutical industry-related content. http://fcpaprofessor.com/category/pharmaceutical-industry/. Accessed April 1, 2022.
[66] Department of Justice. Fraud Statistics — Department of Defense. October 1, 1986-September 30, 2021. https://www.justice.gov/file/1467871/download. Accessed November 26, 2023.
[67] Department of Justice. The False Claims Act: a primer. http://www.justice.gov/sites/default/files/civil/legacy/2011/04/22/C-FRAUDS_FCA_Primer.pdf. Accessed February 6, 2016.
[68] Krause JH. Twenty-five years of health law through the lens of the civil False Claims Act. Ann Health Law. 2010;19(1 Spec No):13-7.
[69] Department of Health and Human Services, Office of Inspector General. Updated OIG guidelines for evaluating state False Claims Acts. March 15, 2013. http://www.oig.hhs.gov/fraud/docs/falseclaimsact/guidelines-sfca.pdf. Accessed February 6, 2016.
[70] National Association of Medicaid Fraud Control Units. Statistical survey: state Medicaid Fraud Control Units, 2021. https://naagweb.wpenginepowered.com/wp-content/uploads/2022/03/Statistics-2021.pdf. Accessed April 11, 2023.
[71] Food and Drug Administration. FDA History – Part II: The Food, Drug, and Cosmetic Act. http://www.fda.gov/AboutFDA/WhatWeDo/History/Origin/ucm054826.htm. Accessed February 26, 2018.
[72] Personal communication with the Department of Justice, Civil Division on August 23, 2012, prior to the publication of the 2012 iteration of this report. This was confirmed by comparing FMAPs with the federal/state share of prescription drug expenditures in a sample of Centers for Medicare and Medicaid Services data from several states over multiple years.
[73] National Association of Medicaid Fraud Control Units (NAMFCU). MFCU Information. MFCUs receive annual grants from the federal government, which fund 75% of the state’s MFCU budget, with the state funding the remainder. http://www.namfcu.net/mfcu-information.php. Accessed February 26, 2018.
[74] Centers for Medicare and Medicaid Services (CMS). CMS-64 Quarterly Expense Report. Financial Management Reports from FY2001 through FY 2022 were downloaded. https://www.medicaid.gov/medicaid/financial-management/state-expenditure-reporting-for-medicaid-chip/expenditure-reports-mbescbes/index.html. Accessed April 10, 2023.
[75] There are historically at least two exceptions to this rule. North Dakota is the only state without an MFCU (National Association of Medicaid Fraud Control Units. Statistical Survey: State Medicaid Fraud Control Units, 2017. http://www.namfcu.net/assets/files/statistical-survey/Statistics%202017%20-%20expended.pdf. Accessed February 12, 2018), and Texas’ MFCU is not the primary agency responsible for prosecuting civil pharmaceutical fraud cases (as in all other states, pharmaceutical fraud cases in Texas are civil). The Attorney General of Texas. Civil Medicaid Fraud. https://texasattorneygeneral.gov/cmf/civil-medicaid-fraud. Accessed February 26, 2018.
[76] National Association of Medicaid Fraud Control Units. 2021 surveys at: https://naagweb.wpenginepowered.com/wp-content/uploads/2022/03/Statistics-2021.pdf. Accessed April 11, 2023.
[77] In the 2005 Deficit Reduction Act (DRA), Congress provided incentives for individual states to enact or strengthen their own FCAs to encourage prosecution of Medicaid fraud. Arguably, the most important provision emphasized in the DRA was whistleblower protection, with states encouraged to increase rewards for whistleblowers in Medicaid fraud settlements to 15-25% of the financial penalties awarded. See House Report 109-362— Deficit Reduction Act of 2005. Sec. 6032. https://www.congress.gov/congressional-report/109th-congress/house-report/362/1. Accessed February 26, 2018.
[78] Centers for Medicare and Medicaid Services. Expenditure Reports from MBES/CBES. https://www.medicaid.gov/medicaid/financial-management/state-expenditure-reporting-for-medicaid-chip/expenditure-reports-mbescbes/index.html. Accessed April 10, 2023. The fee-for-service Medicaid prescription drug net expenditures were obtained by adding up the three rows in the source documents titled “Prescribed Drugs,” “Drug Rebate Offset — National,” and “Drug Rebate Offset — State Sidebar Agreement.” The rows titled “MCO” and “Increased ACA Offset” were excluded.
[79] Personal communication with Meagan Khau, health insurance specialist, Centers for Medicare and Medicaid Services. July 13, 2015.