
The Impact of LNG Exports on U.S. Energy Bills and Inflation
By Public Citizen and Symons Public Affairs
Why are Americans paying more than ever before on our energy bills — even though domestic energy production is surging? One crucial reason is that big oil and gas companies are sending more American energy overseas than ever before. In particular, the rapid growth of natural gas exports has been a leading driver of energy inflation and price volatility in the United States.
Since 2016, when the United States first started exporting liquefied natural gas, domestic gas production has increased 45 percent. Despite the surge in domestic production, American households and businesses have seen their gas bills go up, not down. The United States has been exporting more and more natural gas, and is now the leading LNG exporter in the world.
By tying America’s natural gas prices to overseas markets, LNG exports have made U.S. natural gas consumers vulnerable to global market volatility and price shocks similar to fluctuating gasoline prices at the pump. As a result, oil and gas companies have reaped record-breaking windfall profits at the expense of U.S. households and businesses.
The results were particularly damaging in 2022, when U.S. natural gas price spikes reflected global price shocks after Russia invaded Ukraine. All told, American consumers spent $142 billion more on natural gas in 2022 ($269.5 billion) than they did in 2016 ($127.6 billion), according to federal data.
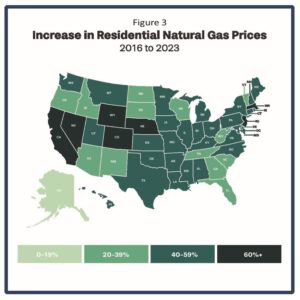
Across the country, the price households paid for natural gas has increased 52% since 2016, according to the U.S. Energy Information Administration. Households in Massachusetts, Nevada, New Jersey, Nebraska, Colorado, and Wyoming have been hit especially hard, paying at least 60% more in residential gas prices.
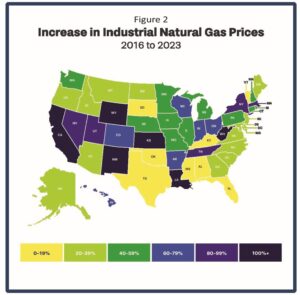
The price of natural gas was up 31% for industrial customers nationwide over the same time frame. Businesses in Nevada (94%), New York (84%), Utah (81%), Massachusetts (81%) and Colorado (73%) saw the biggest increases.
Prices for U.S. consumers were relatively stable when gas export volumes were relatively low, then trended upward starting in 2021 as the United States continued to add export capacity (Figure 1). After price spikes in 2022 driven by global price shocks, industrial prices slid back somewhat last year. Residential prices have remained high (Figure 2 and Figure 3).

These price spikes have reverberated around the economy. Homes and businesses paid more for electricity bills because many power companies rely on gas. The price of natural gas used by electric utilities to generate power surged by 150% between 2016 and 2022 only to fall back in 2023. Even so, it was still up 17% from 2016 levels. American families and businesses spent nearly $105 billion more on electricity in 2023 than in 2016.
Costs also spiked for the fertilizer industry, boosting costs for farmers and lifting prices in the grocery aisle. Fertilizer prices in North America, which are tied closely to natural gas prices, spiked across the U.S. due to global price volatility and LNG exports, with fertilizer prices soaring by more than 400%.
LNG exports have contributed to record energy debt for low-income households. One out of six households are behind on their home energy bills, and the amount they owe to their utilities has reached record levels.
Recent events underscore the link between LNG exports and domestic prices. In June 2022, 17% of U.S. LNG export capacity was knocked offline by a massive explosion and fire at Freeport LNG in Texas. U.S. natural gas prices quickly fell 30 percent – demonstrating that high export volumes had made natural gas more expensive, and that reducing exports eased prices.
Oil and gas companies are proposing a massive expansion of LNG exports. The industry has already approved enough LNG projects to nearly double the current export capacity by 2028, and they hope to add even more.
Oil and gas companies stand to earn higher profits from selling gas to foreign buyers who typically pay much higher prices than in the U.S. LNG exports also boost oil industry profits by lifting the prices paid by domestic consumers. As the Federal Energy Regulatory Commission has warned: continued growth in exports, including from LNG terminals “will place additional pressure on natural gas prices.” According to a survey by the Dallas Federal Reserve of 134 oil and gas firms, 84% of oil & gas executives “expect the age of inexpensive U.S. natural gas to come to an end” as liquefied natural gas exports grow.
Additional approvals of U.S. LNG facilities will lead to higher energy bills for consumers in the long term and create greater energy price volatility. The latest official energy forecast from the U.S. government predicts that U.S. natural gas prices (Henry Hub) will be 33 percent higher if LNG growth continues unchecked, compared to a more constrained scenario. In Senate testimony, Deputy Energy Secretary David Turk warned about linking U.S. natural gas prices to global competition because natural gas prices in Europe and Asia have been five to six times higher than U.S. prices, and because “natural gas prices have been relatively stable in the U.S. compared to European and Asian markets, where benchmark prices for natural gas have been about 50-100% more volatile.”
More than 80 years ago, Congress wisely found that transporting and selling natural gas for public distribution is “affected with a public interest” and subjected interstate and foreign transportation of gas to federal regulation. In January, 2024, the Department of Energy announced that it will reassess the impacts of LNG on public interest. In his written Senate testimony, Deputy Secretary Turk wrote, “our updated economic analysis aims to ensure that we are accurately capturing the full economic impacts of LNG exports to all American consumers and manufacturers,” DOE’s analytical update is an important opportunity to scrutinize the potential impacts of expanded LNG exports on U.S. households, businesses, and farms.
Change in Gas Residential and Industrial Gas Prices 2016-2023
* Indicates 2016-2022 data, 2023 data is not yet available
| State | Residential | Industrial |
|---|---|---|
| United States | 52% | 31% |
| Alabama | 45% | 11% |
| Alaska | 16% | 33%* |
| Arizona | 28% | 29%* |
| Arkansas | 54% | 67% |
| California | 70%* | 102%* |
| Colorado | 61% | 73% |
| Connecticut | 46% | 43% |
| Delaware | 49% | 34% * |
| District of Columbia | 54% | n/a |
| Florida | 22% | 3% |
| Georgia | 38% | 31% |
| Hawaii | 46% | 61% |
| Idaho | 20% | 28% |
| Illinois | 46% | 47% |
| Indiana | 46%* | 61% |
| Iowa | 43% | 45% |
| Kansas | 46%* | 127%* |
| Kentucky | 55% | 11% |
| Louisiana | 44% | 118%* |
| Maine | 50% | 36% |
| Maryland | 50% | 39%* |
| Massachusetts | 71% | 81% |
| Michigan | 41% | 54% |
| Minnesota | 51% * | 41% |
| Mississippi | 45%* | 15% |
| Missouri | 57% | 47% |
| Montana | 40% | 30% |
| Nebraska | 63% | 40% |
| Nevada | 66% | 99% |
| New Hampshire | 44% * | 54% * |
| New Jersey | 63% | 38% |
| New Mexico | 35% | 130% * |
| New York | 56% | 84% |
| North Carolina | 55% | 23% |
| North Dakota | 35% | 27% |
| Ohio | 52% | 60% |
| Oklahoma | 41% | 8% |
| Oregon | 35% | 39% |
| Pennsylvania | 51% | 51%* |
| Rhode Island | 49% | 47% |
| South Carolina | 39% | 22% |
| South Dakota | 36% | 11% |
| Tennessee | 35%* | 80%* |
| Texas | 50% | 3% |
| Utah | 47%' | 81% |
| Vermont | 21% | 9% |
| Virginia | 48%* | 20% |
| Washington | 45% | 53% |
| West Virginia | 30%* | 179%* |
| Wisconsin | 35% | 69% * |
| Wyoming | 60% | 117%* |