Testimony to USITC: Distributional Effects of Trade and Trade Policy on U.S. Workers
Testimony of Melinda St. Louis Director, Public Citizen’s Global Trade Watch before U.S. International Trade Commission
Mister Chairman and members of the Commission, thank you for the opportunity to testify today on the distributional effects of U.S. trade and trade policy on U.S. workers. I am Melinda St. Louis, director of Public Citizen’s Global Trade Watch. Public Citizen is a national public interest organization with more than 500,000 members and supporters. For 50 years, we have advocated with some considerable success for consumer protections and more generally for government and corporate accountability.
Historically, the trade policy community in Washington breathlessly touted the benefits of U.S. free trade agreements, while often flippantly referring to “winners and losers” as an afterthought. But that narrative was clearly pushed by the relatively small number of corporate “winners”. The damage caused by the corporate-led hyperglobalization that has been implemented over the past decades by “trade” agreements such as the North American Free Trade Agreement (NAFTA), the World Trade Organization (WTO) and NAFTA-style free trade agreements (FTAs) has been well documented — from mass job offshoring to unreliable supply chains to downward pressure on wages to weakened consumer and environmental protections. That’s why it is so important that the Commission has embarked on this discussion of the distributional effects – not as an afterthought, but as central to the discussion of U.S. trade policy.
Since the 2016 election, many have reflected on how Donald Trump hijacked progressives’ critique of corporate globalization and job offshoring but reframed it into a narrative of resentment with racialized appeals to target white working-class voters, focusing on white noncollege educated workers as the main victims of corporate-led hyperglobalization.
Today, I’d like to share the findings of a Public Citizen report from 2021 that challenges that narrative by demonstrating that the trade-related decline of U.S. manufacturing had a dire impact on racial minorities, particularly African Americans. In many ways, the damage has fallen disproportionately on people of color in the United States.
Since the start of NAFTA and the WTO, 3.2 million U.S. jobs have been U.S.-government-certified as lost to trade just under the Trade Adjustment Assistance (TAA) program. More than a million of these job losses are attributed to NAFTA. TAA, which provides qualified workers extended unemployment benefits and retraining funds, represents a significant undercount of trade-related job loss given it only covers certain types of jobs, and workers need to know to apply and then must fill out lengthy applications that prove the trade connection. The U.S.-China overall deficit increased by $192 billion, and millions of American jobs were lost in what is now understood as the “China Shock.”[1] Notably, after Congress approved China’s entry into the WTO in 2000, the overall U.S. trade deficit with China soared 164%, according to the U.S. Census Bureau. U.S. Bureau of Labor Statistics’ data show that during the NAFTA-WTO-China PNTR era, over 60,000 U.S. factories have closed, and overall net U.S. manufacturing employment has declined by 4.5 million — one out of every four U.S. manufacturing jobs.[2] U.S. median wages have been stagnant during this period with most manufacturing workers who lose jobs to trade and find reemployment forced to take pay cuts. Two of every five rehired in 2018 were paid less in their new job, with one in six losing greater than 20% of their income.[3] For the average Latino or Black worker earning the median manufacturing wage of $39,500 per year, this meant an annual loss of at least $7,900.
It’s important – when we talk about “distributional effects” and share statistics about job offshoring, that we remember that each displaced worker is a person who is part of a community and has a story. Like for example Ghana Goodwine-Dye, former Michigan autoworker and president of her United Automobile Workers (UAW) local, who shared with us her experience and that of her coworkers who lost their jobs when their plant closed in 2019. “When our jobs were shipped to Mexico, it created a void for the whole community, not just where the plant was, but the communities where members lived, which encompassed a lot of the metropolitan Detroit area. Through our UAW contract, we retained an option to move to another plant, but that meant workers would have to uproot themselves and their families and move out of state, which wasn’t possible for many, so they lost their viable income. These manufacturing jobs are important because they are well-paying jobs, and there aren’t well-paying jobs being created in their place. We’re hoping with President Biden, we can start creating those well-paying jobs, and start building the diminishing middle-class back.”
While decades of such corporate-rigged trade policies have harmed many American workers of all races and ethnicities, Black and Latino workers who lost jobs and experienced wage stagnation from NAFTA, the agreements enforced by the WTO, and the “China Shock” following China’s entry into the WTO have assumed a disproportionately large share of the harm inflicted by these deals. U.S. government data — despite shortcomings as to the recognition of the complexities of race and ethnicity — show that these two groups were overrepresented in the industries and concentrated in the regions that were hit hardest.
Job offshoring and the decline of manufacturing especially affect Black and Latino workers due to the damaging disparities in educational opportunities resulting in Black and Latino workers being overrepresented in the non-college educated workforce and the way in which increased competition for a reduced number of quality jobs available for non-college educated workers exacerbates underlying racial biases.
The outcome: Latino and Black workers impacted by “trade” deals struggle harder to find new jobs and face larger pay cuts when they do. This entrenches and widens significant income and wealth inequality existing between Black and Latino families relative to their white counterparts, contributing to the racist economic structure prevalent in the United States.
1. Black and Latino Manufacturing Job Loss Due to Trade
The dramatic decline of the U.S. manufacturing sector over the past three decades has disproportionately harmed Black and Latino workers. A strong manufacturing sector means higher wages, better working conditions, greater rates of unionization, and more economic stability. Manufacturing wages are higher, on average, than those in the service sector, a fact often twisted to claim that export-related jobs have higher-than-average wages. For example, U.S. workers in the manufacturing sector earned an average of $27.70 per hour in 2019, compared to $16.56 in leisure and hospitality, and $19.68 per hour in retail, which are sectors with numerous jobs also available for workers without college degrees.
The negative consequences that the decline of manufacturing has had on African American families has been the subject of several recent studies. In 2018, the Alliance for American Manufacturing issued a report documenting how high and long-term unemployment experienced by African Americans due to deindustrialization contributed to the impoverishment of Black communities. This study further explains how deindustrialization spurred a loss of personal wealth for African Americans, along with population loss and segregation and decline in municipal financial resources in deindustrialized communities, whose remaining residents were mainly Black.[4] Additionally, Professor Eric D. Gould of the Hebrew University of Jerusalem provided empirical evidence showing that manufacturing decline between 1960 and 2010 had a disproportionate impact on Black communities in terms of wages, employment, marriage rates, house values, poverty rates, death rates, single parenthood, teen motherhood, child poverty, and child mortality.[5]
People of color, both inside the United States and in the Global South, have borne the brunt of the damage caused by corporate-led globalization. U.S. trade policies have had devastating effects in the developing world. NAFTA, for example, displaced more than two million Mexicans engaged in farming and related work after floods of subsidized U.S. corn flowed into Mexico after the country eliminated policies that had only allowed corn imports if domestic production failed to meet demand.[6] Many of the NAFTA-displaced headed to Mexican border maquila factory towns and across the U.S. border in search of work, creating a precarious workforce that was easily exploited by companies on both sides of the border.[7] Since then, Mexico’s real wages have decreased, and over half of the population still lives in poverty.[8]
2. Trade-Related Job Loss Is Concentrated in Economic Sectors with Significant Black and Latino Employment
The narrative that white noncollege educated workers were the primary victims of trade-related job loss is not borne out by the data. In reality, trade-related job loss is concentrated in economic sectors with significant Black and Latino employment. The percentage of African Americans and Latinos working in the manufacturing sectors hit the hardest is greater than their overall representation in the U.S. workforce. The table below shows the 10 manufacturing subsectors that experienced the greatest trade balance decline between 1993 and 2019.[9]
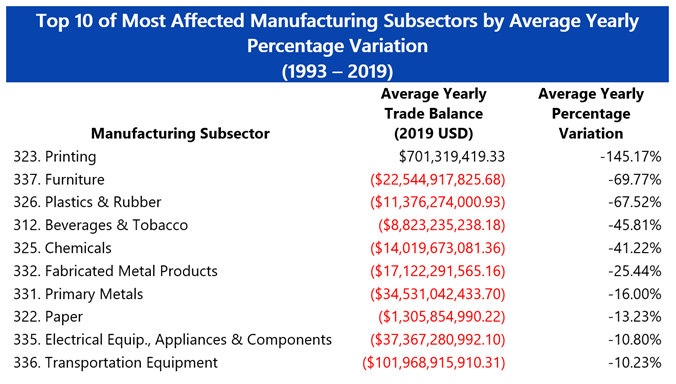
Source: U.S. International Trade Commission[10]
African Americans, Latinos or both represented a modestly larger share of the workforce compared to their share of the entire working population in nine of the 10 industries listed above in 1995, the earliest year with employment data by detailed industry and race and Hispanic origin that is proximate to the start of the NAFTA and WTO era. While Latinos comprised 8.9% of the labor force, they represented 12.3% of workers in the manufacturing of fabricated metals, 11.4% of furniture and 10.5% of plastics and rubber.[11] While Black workers comprised 10.6% of the overall labor force in 1995, they represented 13.5% of the workforce in paper manufacturing, 11.4% in chemicals, 11.3% in transportation equipment and 11.1% in primary metals.[12] African Americans and Latinos represented 13% and 15.4%, respectively, of the workforce in the beverages industry.
Black workers have lost nearly half a million manufacturing jobs (494,000) during the NAFTA-WTO era,[13] evenly spread across several subsectors. Comparing Bureau of Labor Statistics’ employment data for 1995 and 2019, Black workers were disproportionately represented in the primary metals manufacturing sector hit by the NAFTA-WTO era with a loss of 53,800 jobs. Black workers have also lost 22,100 jobs in the paper manufacturing industry and 18,600 jobs in the beverages and tobacco industry during the NAFTA-WTO era, two more sectors where Black workers were overrepresented relative to their general share of the workforce. In the last 25 years African Americans also lost 120,900 jobs in electrical equipment and appliances, 51,200 jobs in fabricated metals, and 30,200 jobs in plastics and rubber manufacturing, sectors in which Black workers were not overrepresented.[14] In the automotive sector, between 1995 and 2010 alone – the first 15 years of NAFTA – Black workers lost 56,524 jobs.[15]
Latino workers also experienced job losses in sectors where they were overrepresented when NAFTA and the WTO went into effect and U.S. manufacturing workers faced the pincer move of harsh import competition and production offshoring. However, today Latinos represent almost double the share of the U.S. workforce relative to 25 years ago — from 8.9% to 17.6%. As a result, more Latinos work in various manufacturing industries today compared to 1995. While many Mexican workers on the other side of the border found jobs in maquiladoras where U.S. companies paid Mexican workers less than $2 per hour producing electrical equipment and appliances for the U.S. market in the NAFTA period, U.S. Latinos lost 123,000 jobs in the decline in the U.S. electrical equipment and appliances industry.[16] Perhaps more infamously, during the last 25 years 182,700 Latino jobs in the United States have been lost in textiles, apparel and leather manufacturing.[17] The California garment sector centered in Los Angeles, with an estimated 80% Latino workforce, was one of these casualties.[18]
The explosion of trade deficits in the aforementioned sectors — along with the offshoring threat — not only resulted in significant job loss for people of color across the United States, it also contributed to the stagnation of wages, which was especially acute in highly trade-impacted manufacturing industries. According to research from professors John McLaren from the University of Virginia and Shushanik Hakobyan from Middlebury College found that NAFTA reduced wage growth in the most affected industries by 17 percentage points relative to other industries.[19]
Globalization and trade deals have also impacted Black and Latino workers with service sector jobs. Call center jobs provide an example of service sector jobs for which many workers benefit from union representation that are being mass outsourced to low wage countries, like the Philippines. Some 58,220 of the U.S. jobs certified as lost to the Philippines are designated as explicitly lost to offshoring. People of color (i.e., Black, Asian and Latino Americans) account for 43% of U.S. workers engaged as customer service representatives. Some 71,788 U.S. jobs are TAA-certified as lost to trade with the Philippines, with 58,220 of those jobs designated as explicitly lost to offshoring. Initially TAA did not cover service sector workers at all, so waves of call center and other service-sector instances of mass offshoring were not counted. More offshoring is projected for call center jobs, with the U.S. Bureau of Labor Statistics having forecast that an additional 51,600 American jobs would be lost in the sector between 2018 and 2028.
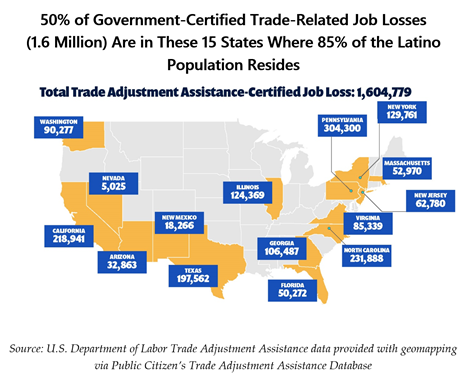
3. Trade-Related Job Loss Is Concentrated in States with Greatest Black and Latino Populations
Just 15 U.S. states that are home to 85% of the total U.S. Latino population[20] account for half of TAA-certified trade-related job losses – 1.6 million of the more than 3.2 million U.S. jobs lost – from the start of the NAFTA-WTO era in 1994 to the latest TAA certifications, which cover most of 2019.[21] Those 15 states also account for nearly half (47%) of all TAA-certified job losses caused by NAFTA – 480,000 out of 1.01 million.[22] Moreover, 2.4 million of the 4 million total manufacturing job losses documented by the U.S. Bureau of Labor Statistics during the NAFTA-WTO era supported working families in these 15 states.[23]
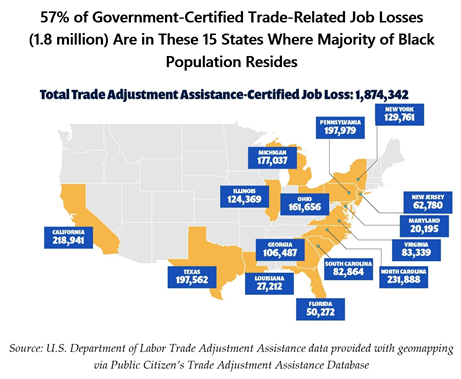
Just 15 states that are home to 58% of the Black population[24] account for 57% of TAA-certified trade-related job losses – 1.8 million of the more than 3.2 million U.S. jobs – between the start of the NAFTA-WTO era and mid-2019.[25] Additionally, 57% of TAA job losses caused by NAFTA — since NAFTA’s implementation up to April 2020 — happened in these 15 states.[26] These 15 states also account for 2.9 million of the 4 million total manufacturing job losses documented by the U.S. Bureau of Labor Statistics during the NAFTA-WTO era.[27]
Many of the states — and cities such as Detroit, Chicago, Pittsburgh, New York, and Cleveland — that were hardest hit by U.S. trade policy failures were locations whose growing manufacturing employment opportunities had drawn six million Black workers fleeing racial terror and poverty in the Jim Crow South for safety and better economic opportunities in the first half of the 1900s.[28]
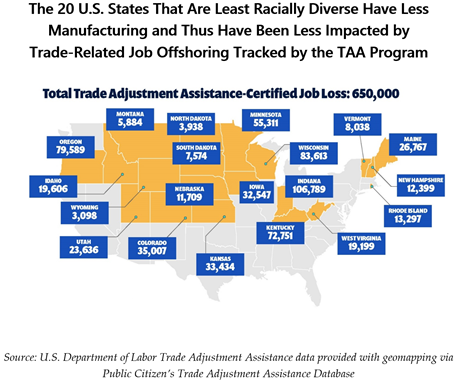
The 20 U.S. states that are least racially diverse also are states that have less manufacturing and thus have been less impacted by trade-related job offshoring tracked by the TAA program. Combined together, Maine, Vermont, West Virginia, New Hampshire, Idaho, Wyoming, Iowa, Utah, Montana, Nebraska, Kentucky, Wisconsin, Colorado, North Dakota, Oregon, Kansas, Indiana, South Dakota, Minnesota, and Rhode Island represent 650,000 of the 3.2 million TAA certified job losses and less than 10% (only 300,000 of the total 4 million) of U.S. manufacturing job losses during the NAFTA-WTO era, according to the U.S. Bureau of Labor Statistics. [29]
4. Black and Latino Workers Are Overrepresented Among Those Whose Wages Have Stagnated Since NAFTA
Compounding the devastating statistics of disproportionate job loss, Black and Latino workers face the harsh reality of underlying racial biases that impact hiring and promotion prospects, further exacerbating wage stagnation and generational opportunity.
As of 2019, 77% of Latinos and 68% of Black Americans do not have college degrees, compared to 54% of the white population.[30] Disparities in educational opportunities led to Black and Latino workers being overrepresented in the manufacturing workforce relative to their overall share of the workforce, as the manufacturing sector provides well-paid jobs for workers without college degrees. As corporate trade pushes production lines offshore, the 58% of Americans without college degrees are left to compete for an ever-diminishing number of good, stable jobs.
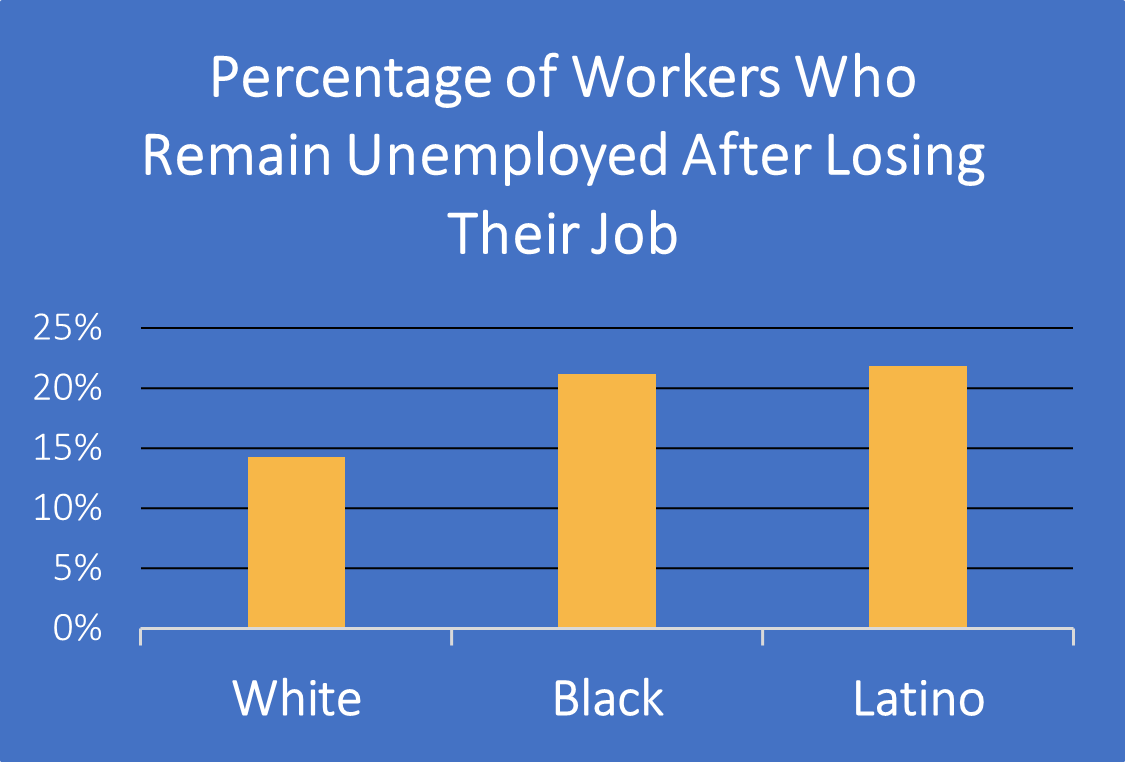
The increased competition for a smaller number of quality jobs available to non-college educated workers adds fuel to the fire of existing racial dynamics and prejudices that results in discriminatory hiring practices and wage disparities. Looking again at statistics from the Bureau of Labor, U.S. Latino and Black workers who lose their jobs are less likely than their white counterparts to find a replacement job. In fact, for every 100 Latino workers who lose their jobs, 21.8 remain unemployed. For Black workers, that drops to 21.2. For white workers? Only 14.3 remain unemployed.
Even within employment in manufacturing, controlling for educational differences, a study by the Economic Policy Institute estimates that actual wages for Latino and Black workers are about 25% and 23% lower compared to non-Latino white workers.[31] That study also found that almost one million Black, Latino and Asian workers who were displaced as a result of the China trade-induced deficit suffered a net pay cut as large as 25.5%, a net loss of almost $10,500 per worker per year.[32]
For those workers who lose manufacturing jobs and are able to find new jobs, disproportionate pay cuts are waiting. More than half of Black workers and 60% full-time Latino workers earn less than $15 per hour, compared the US average of 42%.[33]
There is an existing, debilitating wage gap between Black and Latino workers relative to white Americans across all sectors. At the start of the NAFTA-WTO era, Black men earned 75 cents for every dollar earned by white men, and Black women earned 88 cents for every dollar earned by white women.[34] Similarly, Latino men earned 64 cents for every dollar earned by white men, and Latinas earned 78 cents for every dollar earned by white women. As of 2018, in inflation-adjusted terms, the wage gap for Black men had only closed by 4 cents, to 79 cents. For Black women, the wage gap actually increased by 5 cents, to 83 cents for every dollar earned by white women. For Latino men in 2018, the wage gap closed by 7 cents, to 71 cents for every dollar earned by white men, and for Latinas it also widened by 5 cents, to 73 cents for every dollar earned by white women.
About two out of every five manufacturing workers displaced and rehired experienced a wage reduction; in fact, about one of every four took a pay cut larger than 20%, meaning an annual loss of nearly $8,000 for the average Latino or Black worker earning the median manufacturing wage ($39,500 per year).[35]
Workers are forced to accept these pay cuts because there are only so many non-offshorable, non-professional or non-degree-requiring jobs, such as in the hospitality or retail industry. Greater competition for fewer jobs, combined with a nationwide decline in union membership has led to race-to-the-bottom wages. While it is true that all US workers with similar education levels have suffered growing economic insecurity in the wake of the NAFTA-WTO period, the structural biases in educational levels and racial prejudice adds a toxic fuel to the race to the bottom.
Real wage growth has been modest in the sectors of hospitality and leisure as increasing numbers of trade-displaced workers join the competition for these non-offshorable jobs. The manufacturing sector lost about 4 million jobs between 1993 and 2019; meanwhile, the leisure and hospitality sector— with an average wage that is 40% less than the average manufacturing wage— gained 6.8 million jobs.[36] Latino and Black workers make up a disproportionate number of the jobs in these sectors relative to their overall share of the US workforce.[37]
Furthermore, the loss of manufacturing jobs doesn’t just harm those directly in the sector. Each manufacturing job lost means less income spent supporting other sectors in communities with large Black and Latino populations. According to a study from the Manufacturers Alliance for Productivity and Innovation Foundation, each manufacturing job in 2016 producing value for “final demand” supported more than three other jobs in the supply chain. Every manufacturing job lost jeopardizes these other jobs, as well as community business such as restaurants and local shops that workers losing wages can no longer afford to patronize.[38]
Government services and construction jobs supported by the taxes of manufacturing firms and well-paid workers all also take a significant hit.[39] In 2014, the Communications Workers of America calculated an annual cost due to trade-induced job loss that reached $35 billion in Social Security revenue.[40] In 2012, Economic Policy Institute estimated that 69% of Latino and 60% of Black Americans age 65 or older had incomes less than two times the supplemental poverty threshold, compared to 44% of whites, forcing a wide majority of Black and Latino elders to spend their retirement at or near the poverty level.[41]
5. Conclusion
I would like to thank the Biden Administration and the commission for this investigation into the effects of trade on workers and underserved communities. As people throughout the United States struggle to confront the deep-seated structural racism that for too long has been a cornerstone of the American experience, this testimony aims to elevate how the outcomes of our trade policies and agreements have reinforced a racially biased system, while also hurting working people and communities of all races and ethnicities. Unpacking the outcomes of the current policies is a critical first step in trying to understand the causes of the racial disparities the data reveal.
Certainly, the context of generations of racial discrimination in hiring, promotion, wage and educational opportunities establishes an adverse setting in which trade-related job-loss and wage suppression will have more painful impacts on Latinos and African Americans. But what features of trade agreements and policies themselves may drive racial disparities? Exploring such factors, as well as remedies, merits urgent attention. What is clear is that rethinking our trade agreements and policies should not be limited to aiming to halt the decline of manufacturing in the country or making our economy more resilient to crises, but also to contributing to the fight for a more just and inclusive society.
_______________
[1] See https://chinashock.info/ China trade data at U.S. Bureau of Economic Analysis, “International Trade in Goods and Services,” U.S. Trade in Goods and Services by Selected Countries and Areas, 1999-present, extracted July 17, 2020. Available at: https://www.bea.gov/data/intl-trade-investment/international-trade-goods-and-services. Adjusted for inflation to base month May 2020.
[2] U.S. Census Bureau, 2018 Business Dynamics Statistics, extracted October 14, 2020. Available at: https://www.census.gov/data/tables/time-series/econ/bds/bds-tables.html; U.S. Bureau of Labor Statistics, Current Employment Statistics survey, series ID CES3000000001, manufacturing industry, U.S. Department of Labor, extracted February 6, 2018. Available at: http://www.bls.gov/ces/.
[3] U.S. Bureau of Labor Statistics, “Displaced Workers Summary,” Table 7, U.S. Department of Labor, August 28, 2018. Available at: https://www.bls.gov/news.release/disp.t07.htm.
[4] Alliance for American Manufacturing, “Unmade in America: Industrial Flight and the Decline of Black Communities”, October 2016. Available at: https://www.americanmanufacturing.org/press-release/unmade-in-america-industrial-flight-and-the-decline-of-black-communities/.
[5] Eric Gould, “Torn Apart? The Impact of Manufacturing Employment Decline on Black and White Americans”, June 2018, IZA DP No. 11614. Available at: https://ssrn.com/abstract=3198144.
[6] Public Citizen, NAFTA’s Legacy for Mexico: Economic Displacement, Lower Wages for Most, Increased Migration, October 2019. Available at: https://www.citizen.org/wp-content/uploads/NAFTA-Factsheet_Mexico-Legacy_Oct-2019.pdf.
[7] Timothy Wise, “Reforming NAFTA’s Agricultural Provisions,” in The Future of North American Trade Policy: Lessons from NAFTA, Boston University Pardee Center Task Force Report, at 35. Available at: http://www.bu.edu/pardee/files/2009/11/Pardee-Report-NAFTA.pdf.
[8] Public Citizen’s Global Trade Watch, “NAFTA At 25: Promises vs. Reality”, January 1, 2019. Available at: http://infographic.replacenafta.org/nafta-at-25-promises-vs-reality/.
[9] The table was constructed using trade data sourced from the U.S. International Trade Commission discerned by North American Industry Classification System (NAICS) 3-digit codes. Since this system replaced the Standard Industrial Classification (SIC) System in 1997, we used the equivalent SIC codes to retrieve trade data for 1993, 1994, 1995 and 1996. Appendix A includes a chart with the equivalences used.
[10] U.S. International Trade Commission, “dataweb.usitc.gov,” extracted on November 11, 2020. Available at: https://dataweb.usitc.gov/.
[11] U.S. Bureau of Labor Statistics, “Labor Force Statistics from the Current Population Survey: Employed Persons by Detailed Industry, Sex, Race, and Hispanic Origin,” extracted on November 11, 2020. Available at: https://www.bls.gov/cps/aa1995/aat18.txt.
[12] U.S. International Trade Commission, “dataweb.usitc.gov,” extracted on November 11, 2020. Available at: https://dataweb.usitc.gov/.
[13] U.S. Bureau of Labor Statistics, Current Population Survey, Table 18, “Employed Persons by Detailed Industry, Sex, Race, and Hispanic Origin,” 1995 and 2019. Extracted on July 20, 2020. Available at: https://www.bls.gov/cps/aa1995/aat18.txt and https://www.bls.gov/cps/cpsaat18.htm.
[14] Ibid.
[15] Ibid.
[16] U.S. Bureau of Labor Statistics, Current Population Survey, Table 18, “Employed Persons by Detailed Industry, Sex, Race, and Hispanic Origin,” 1995 and 2019. Extracted on July 20, 2020. Available at: https://www.bls.gov/cps/aa1995/aat18.txt and https://www.bls.gov/cps/cpsaat18.htm.
[17] Ibid.
[18] Carol Amoruso, “NAFTA – A Bill of Goods?” Hispanic-American Village, IMDiversity.com, July 21, 2003.
[19] Shushanik Hakobyan and John McLaren, “Looking for Local Labor-Market Effects of NAFTA,” Review of Economics and Statistics, vol 98(4), October 2016: 728 – 741.
[20] U.S. Census Bureau, “Population Estimates: July 1, 2019,” extracted on June 16, 2020. Available at: https://www.census.gov/quickfacts/fact/table/US/PST045219.
[21] Public Citizen, Trade Adjustment Assistance Database, 2020, extracted on June 16, 2020. Available at: https://www.citizen.org/article/trade-adjustment-assistance-database/.
[22] Ibid.
[23] U.S. Bureau of Labor Statistics, “Manufacturing: NAICS 31-33,” Employment in Thousands from Jan. 1994 to Dec. 2019, extracted July 22, 2020. Available at: https://www.bls.gov/iag/tgs/iag31-33.htm. For each of the top 15 states with the highest Latino populations, we calculated the manufacturing jobs in Jan. 1994 and in Dec. 2019, and found the net difference to determine the number of manufacturing jobs lost in those 15 states. To determine the total number of manufacturing jobs lost, we calculated the national manufacturing jobs in Jan. 1994 and Dec. 2019, and calculated the difference.
[24] U.S. Census Bureau, “Population Estimates: July 1, 2019,” extracted on June 16, 2020. Available at: https://www.census.gov/quickfacts/fact/table/US/PST045219.
[25] Public Citizen, Trade Adjustment Assistance Database, 2020, extracted on June 16, 2020. Available at: https://www.citizen.org/article/trade-adjustment-assistance-database/.
[26] Ibid.
[27] U.S. Bureau of Labor Statistics, “Manufacturing: NAICS 31-33,” Employment in Thousands from Jan. 1994 to Dec. 2019, extracted July 22, 2020. Available at: https://www.bls.gov/iag/tgs/iag31-33.htm. For each of the top 15 states with the highest Black populations, we calculated the manufacturing jobs in Jan. 1994 and in Dec. 2019, and found the net difference to determine the number of manufacturing jobs lost in those 15 states. To determine the total number of manufacturing jobs lost, we calculated the national manufacturing jobs in Jan. 1994 and Dec. 2019, and calculated the difference.
[28] Mary M. Chapman. “Black Workers Hurt by Detroit’s Ills”, New York Times, December 29, 2008. Available at https://www.nytimes.com/2008/12/30/business/30detroit.html; Carole Marks, “Black Workers and the Great Migration North,” Phylon (Clark Atlanta University) Vol. 46, No. 2 (2nd Qtr., 1985), pp. 148-161.
[29] U.S. Bureau of Labor Statistics, “Manufacturing: NAICS 31-33,” Employment in Thousands from Jan. 1994 to Dec. 2019. Extracted July 22, 2020. Available at: https://www.bls.gov/iag/tgs/iag31-33.htm. For each of the top 20 least diverse states, we calculated the manufacturing jobs in Jan. 1994 and in Dec. 2019, and found the net difference to determine the number of manufacturing jobs lost in those 20 states. To determine the total number of manufacturing jobs lost, we calculated the national manufacturing jobs in Jan. 1994 and Dec. 2019, and calculated the difference.
[30] U.S. Census Bureau, “Educational Attainment in the United States: 2019,” March 30, 2020, extracted on June 16, 2020. Available at: https://www.census.gov/content/census/en/data/tables/2019/demo/educational-attainment/cps-detailed-tables.html.
[31] Robert Scott, Economic Snapshot, Displaced minority workers suffered 29.6% drop in wages from the growing trade deficit with China, Economic Policy Institute, October 10, 2013, http://www.epi.org/publication/minorityworkers-suffered-29-6-percent-drop/.
[32] Ibid.
[33] Laura Huizar and Tsedeye Gebreselassie, “What a $15 Minimum Wage Means for Women and Workers of Color,” National Employment Law Project Policy Brief, December 2016. Available at: https://s27147.pcdn.co/wp-content/uploads/Policy-Brief-15-Minimum-Wage-Women-Workers-of-Color.pdf.
[34] U.S. Census Bureau, Current Population Survey, “Historical Income Tables, Table P-38: Full-Time, Year-Round Workers by Median Earnings and Sex,” August 28, 2018. Available at: https://www.census.gov/data/tables/time-series/demo/income-poverty/historical-income-people.html.
[35] U.S. Bureau of Labor Statistics, “Displaced Workers Summary,” Table 7, U.S. Department of Labor, August 28, 2018. Available at: https://www.bls.gov/news.release/disp.t07.htm .
[36] U.S. Bureau of Labor Statistics, “Industries by Supersector and NAICS Code,” U.S. Department of Labor, extracted July 22, 2020. Available at: https://www.bls.gov/iag/tgs/iag_index_naics.htm.
[37] U.S. Bureau of Labor Statistics, “Labor Force Statistics from the Current Population Survey,” Table 11: Employed Persons by Detailed Occupation, Sex, Race, and Hispanic or Latino Ethnicity, January 22, 2020, extracted on July 24, 2020. Available at: https://www.bls.gov/cps/cpsaat11.htm.
[38] Dan Meckstroth, “How Important Is U.S. Manufacturing Today?,” Manufacturers Alliance for Productivity and Innovation (MAPI) Foundation, September 13, 2016. Available at: https://www.mapi.net/forecasts-data/how-important-us-manufacturing-today.
[39] Research shows that a broader manufacturing base contributes to a wider local tax base and offering of social services. Henri Capron and Olivier Debande, “The Role of the Manufacturing Base in the Development of Private and Public Services,” Regional Studies, 31:7, October 1997, at 681. Available at: https://www.tandfonline.com/doi/abs/10.1080/00343409750130768. With the loss of manufacturing, tax revenue that could have expanded social services or funded local infrastructure projects is eliminated, which has resulted in the virtual collapse of some local governments in areas hardest hit. Robert Forrant, “Greater Springfield Deindustrialization: Staggering Job Loss, A Shrinking Revenue Base, and Grinding Decline,” Speaker Presentation, April 2005.
[40] Communications Workers of America, “People of Color Beware: Your Jobs, Wages, and Health are at Risk,” Department of Research. Factsheet, December 2014. Available at: http://files.cwa-union.org/national/issues/PolicyIssues/Trade/TPP_Fact_Sheets_11_19_and_on/December-2014-fact-sheets/21041210cwapeopleofcolor.pdf .
[41] Gould, Elise and David Cooper, “Financial Security of Elderly Americans at Risk: Proposed Changes to Social Security and Medicare Could Make a Majority of Seniors ‘Economically Vulnerable.’” Economic Policy Institute Briefing Paper 362, June 6, 2013. Available at: www.epi.org/publication/economic-security-elderly-americans-risk/.