The Well of the Congress
The Wealthiest 10% of Zip Codes Provide 67% of ‘Maxed Out’ Contributions to Congressional Candidates, and the Richest 1% of Zip Codes Account for 25%
By Taylor Lincoln
(This study is easier to read in .pdf format. Download full report here.)
Key Findings
Members of Congress rely extensively on donors who can afford to contribute the maximum allowable amount ($2,800 in 2020). They spend enormous amounts of time soliciting maxed-out contributions, which come from only about 1/33 of 1 percent of the population. This study shows the degree to which those contributions come from the nation’s wealthiest neighborhood and, in turn, do not come from neighborhoods with high ethnic minority populations. It does so by analyzing maxed-out contributions to candidates for Congress from 2016 to 2020.
- Candidates for Congress received more than $1.6 billion in maxed-out contributions in the 2016 to 2020 election cycles. Two-thirds of these contributions came from the wealthiest 10 percent of zip codes.
- The wealthiest 1 percent of zip codes provided one-fourth of maxed-out contributions.
- Zip codes in the top 4 income percentiles accounted for more than half of maxed-out contributions.
- Only 40 percent of zip codes provided a single maxed-out contribution to a candidate for Congress in the past three election cycles.
- Zip codes with a majority white, non-Hispanic population provided four times as much in per capita maxed-out contributions as did majority Hispanic zip codes, and five times as much as majority Black zip codes.
- Eight of the 10 zip codes giving the most in maxed-out contributions are located in New York City and, specifically, in Manhattan.
- Contributions from neighboring zip codes can vary starkly. In New York City, for example, donors from Manhattan gave an average of $86 per person in maxed-out contributions while donors from bordering Bronx and Queens gave 82 cents and 71 cents per person, respectively. (Note that these calculations are spread out across the entire population. Most people do not make a single campaign contribution at all, let alone a contribution approaching $3,000.)
- Washington, D.C., which does not have a voting representative in the U.S. House or Senate, overwhelmingly ranked first in per capita maximum contributions, giving 3.5 times as much per person as any state.
- The zip codes that are home to former President Donald Trump’s Trump Tower building and his Mar-a-Lago club ranked 2nd and 5th, respectively, in total maxed-out contributions out of nearly 32,000 zip codes analyzed. (Both ranked in the top 16 in per capita maxed-out contributions, as well.)
Introduction
Candidates winning election to the U.S. House of Representatives in 2020 spent an average of $2.4 million on their campaigns. Successful U.S. Senate candidates spent an average of nearly $27 million.[1]
Such totals would require raising more than $3,000 a day over two years for U.S. House candidates and more than $12,000 a day for six years for U.S. Senate candidates. To get there, members of Congress spend an enormous amount of time seeking contributions from the tiny slice of the population that can afford to part with thousands of dollars.
By various reports, members of Congress spend an average of 20 to 30 hours per week raising money from wealthy donors.[2] An orientation presentation given to incoming Democratic members of Congress in 2013 recommended spending four hours a day on “call time” to raise money and just a half hour a day on constituent visits.[3]
Lawmakers’ reliance on the wealthiest Americans influences how they carry out their job duties. A study published in 2015, for example, found that campaign donors were four times more likely than ordinary constituents to have a request to meet with a member of Congress granted.[4]
Some politicians have acknowledged that their courtship of wealthy donors has changed the way they see the world. “I know that as a consequence of my fund-raising I became more like the wealthy donors I met, in the very particular sense that I spent more and more of my time above the fray,” then-U.S. Sen. Barack Obama wrote in 2006, “outside the world of immediate hunger, disappointment, fear, irrationality, and frequent hardship of the other 99 percent of the population.”[5]
Except for those who are independently wealthy, candidates rely on campaign contributions for their political survival. Candidates spending the most money have won more than 80 percent of U.S. Senate contests since 2000 and more than 95 percent of U.S. House races.[6]
The majority of money raised by candidates comes from about the roughly one-third of 1 percent of the voting age population who contribute more than $200, which is the threshold at which details of contributions must be disclosed. A sizeable share of that money comes from a small fraction of those donors who can afford to give the maximum allowable amount. The maximum was $2,700 in the 2016 and 2018 election cycles, and $2,800 in 2020.
This study attempts to gain insight into the demographics of big contributors by looking at the income levels and racial compositions of zip codes that furnish congressional candidates with maxed-out contributions.
Intuitively, we know that only the very wealthiest Americans could afford to give nearly $3,000 to a politician. Still, readers might be struck by the degree of correlation documented in this study between neighborhood wealth and the prevalence of maxed-out contributions. For example, in the past three election cycles, residents of zip codes in the four highest income percentiles gave more maxed-out contributions to congressional candidates than the other 96 percent of zip codes, combined.
Additionally, this study shows that maxed-out contributions decline steadily as minority populations rise. This finding follows up on 2020 Public Citizen study, which found that the 10 majority-white zip codes giving the most campaign contributions gave eight times as much as the 10 top contributing majority-minority zip codes. Further, it found that the 10 white zip codes giving the most to super PACs outpaced super PAC donors from minority zip codes by a factor of 15.[7]
As stark as the findings of this study are, they almost certainly understate the degree to which large campaign contributions come from the wealthiest Americans. Even in the wealthiest zip codes, there is a wide range of incomes. If we were privy to data on which members of the wealthiest zip codes provided maxed-out contributions, that data would almost certainly show that the biggest donors tend to be the wealthiest of the wealthy.
Similarly, to the extent that this study shows maxed-out contributions being provided by residents of zip codes in the lower or middle tiers of the household income spectrum, that should not be taken to suggest that the actual donors were people of regular means. Instead, those contributions likely came from extremely wealthy families that happen to live in zip codes with wide wealth disparities. An example highlighted in this report illustrates that phenomenon. About 20 members of a single Michigan family living in a zip code with a mean income about equal to the national average gave $2.8 million in maxed-out contributions. The other 37,000-plus people in the same zip code gave less than $500,000, combined.
Finally, this study’s focus on maxed-out campaign contributions ignores the billions of dollars that have been poured into super PACs and dark money groups for which no contribution limits exist. Donors who give hundreds of thousands – or even millions – of dollars to these entities are inherently extraordinarily wealthy regardless of what zip code they live in.
Despite these qualifiers, this study clearly shows that the vast majority of conventional campaign contributions comes from America’s wealthiest neighborhoods, which leads to two unavoidable conclusions: 1. Particularly wealthy Americans play a vastly disproportionate role in determining the viability of prospective congressional candidates. 2. Those candidates, in turn, have a strong incentive to adopt positions that align with wealthy donors’ interests.
The Freedom to Vote Act Would Wean Congressional Candidates From Their Dependence on Extremely Wealthy Donors
There is a way to provide viable candidates with enough money to disseminate their message to voters without incentivizing them to bend to the will of wealthy donors. That system, which enjoyed a successful test for decades at the presidential level, is to offer public funding to candidates.
The Freedom to Vote Act, which is pending in Congress, would provide public matching funds to candidates for Congress who demonstrate their viability by raising at least $50,000 in small dollar contributions from at least 1,000 donors. Qualifying candidates would receive $6 for every $1 they raise in contributions of $200 or less, subject to some limits. In exchange for receiving public funding, candidates would agree not to accept any campaign contributions of more than $1,000.[8]
Such a system would serve the dual purpose of weaning candidates off of their dependence on the wealthiest 1 percent of Americans while encouraging them to listen more to the wishes of the other 99 percent.
I. A Minuscule Slice of the Population Fuels the Campaigns of Congressional Candidates
While campaign contributions play a major role in determining the outcomes of our elections, only a tiny percentage of Americans are significantly involved in this process.
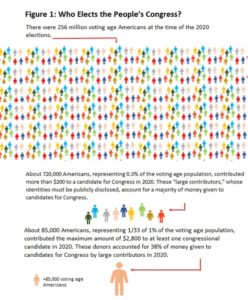
About 60 percent of the campaign contributions that winning congressional candidates received in the 2020 elections came from donors giving more than $200. These “large donors,” whose contributions must be reported to the Federal Election Commission, made up only about one-third of 1 percent of voting age Americans in 2020.[1]
As stunning as it may be that such a tiny percentage of Americans play such a significant role in deciding elections, a much smaller slice of the population exerts an even more disproportionate influence.
About 40 percent of the money that congressional candidates receive from large donors comes from those who give the maximum amount. Only about 85,000 people,[2] comprising about 1/33rd of 1 percent of voting age Americans, made a maxed-out contribution to a candidate for Congress in 2020. [Figure 1]
Maxed-out contributions overwhelmingly come from the nation’s wealthiest neighborhoods. More than two-thirds of all maxed-out contributions to candidates for Congress in the 2016 to 2020 election cycles came from households in the top income decile, meaning the wealthiest 10 percent of zip codes by average income. [See Table 1, which is depicted graphically in Figure 2]
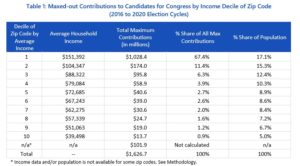
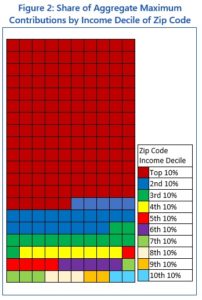
The discrepancy between deciles illustrated in Table 1 and Figure 2 is somewhat exaggerated because wealthier zip codes tend to have bigger populations than poorer ones, likely because wealthier zip codes are often in urban areas. The 1st income decile accounts for 17.1 percent of the population, while the 10th income decile accounts for only 5 percent.
But after adjusting for population, the wealthiest decile still accounts for an overwhelming share.
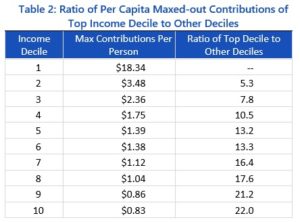
On a per-person basis, maxed-out contributions from the wealthiest decile were more than 5 times greater than those from the second-wealthiest decile, and more than 20 times greater than both the 9th and 10th deciles. [Table 2]
Even within the wealthiest 10 percent of zip codes, the disparity in giving is enormous.
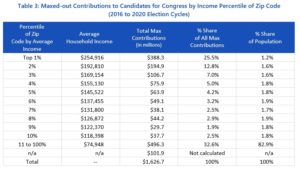
Zip codes in top 1 percent of household income made $388 million in maxed-out contributions to candidates for Congress in the last three election cycles, accounting for more than a quarter of all maxed-out contributions made by the entire country.
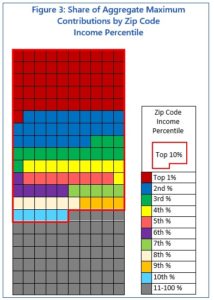
The top 1 percentile’s share was nearly double the maxed-out contributions from zip codes in the second wealthiest percentile. Zip codes in just the top four income percentiles, in turn, accounted for more than half of all maxed-out contributions, nationwide. [Table 3 and Figure 3]
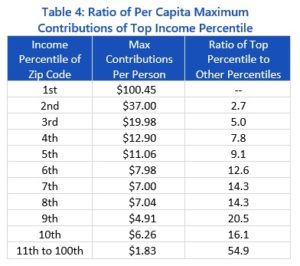
The ratio of contributions between the wealthiest 1 percent of zip codes to other zip codes in the top decile appears even greater after adjusting for population.
Per capita contributions from the wealthiest 1 percent of zip codes were 2.7 times greater than zip codes in the 2nd percentile, 16 times greater than those in the 10th percentile, and more than 50 times higher than those in the 11th to 100th percentiles. [Table 4]
About 92 percent of maxed-out contributions from zip codes in the top income percentile came from 10 states plus the District of Columbia. More than 55 percent came from New York and California. [Table 5]
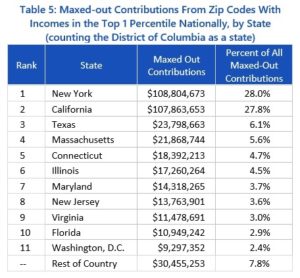
The dominance of New York and California in maxed-out contributions from the top income percentile of zip codes is partly due to those states’ large populations and the prevalence of wealthy neighborhoods within them.
But a similar group of states appear at the top after adjusting for population and including all income percentiles. New York ranks second in per capita giving across all zip codes. California ranks sixth.
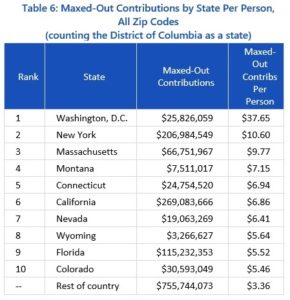
Washington, D.C., which does not have a voting representative in the U.S. House or Senate, overwhelmingly ranks first in per capita maximum contributions, giving 3.5 times as much per person as any state. [Table 6]
Partly because its zip codes have high populations, New York City dominates the list of zip codes giving the most in maxed-out contributions. Eight of the 10 top zip codes in total maxed-out contributions from are in New York City, and in the Manhattan borough, specifically.
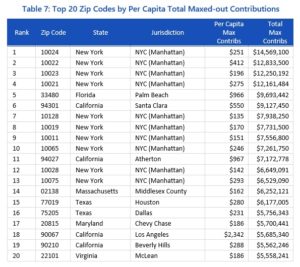
The Manhattan zip code of former President Donald Trump’s Trump Tower (10222) and the Palm Beach, Fla., zip code of Trump’s Mar-a-Lago club (33480) ranked 2nd and 5th nationally in total maxed-out contributions out of nearly 32,000 zip codes analyzed. Beverly Hills 90210, the namesake of the 1990s television show, ranked 19th. [Table 7]
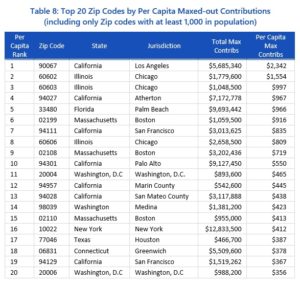
We also ranked zip codes by their maxed-out contributions on a per capita basis. For this comparison, we excluded those that had populations of less than 1,000 because small zip codes are prone to wide swings based on the contributions of just a few people. About 23,000 zip codes out of nearly 32,000 included in this study had populations of at least 1,000.
Of the 20 zip codes with the highest per capita maxed-out contributions, seven were in California, and all but one of those was in Northern California. Boston and Chicago each had three zip codes in the top 20, while Washington, D.C., had two. The zip codes including Mar-a-Lago and Trump Tower ranked 5th and 16th, respectively, in per capita maxed-out contributions. [Table 8]
Nearly 65 percent of maxed-out contributions from New York State came from New York City. But that comparison does not fully illustrate the degree to which maximum contributions are concentrated.
Of $152.8 million in maximum contributions furnished by the 179 New York City zip codes for which population and income data is available, $139.6 million – more than 90 percent – came from just 23 zip codes that gave more than $1 million. All but one of those zip codes is in the borough of Manhattan.
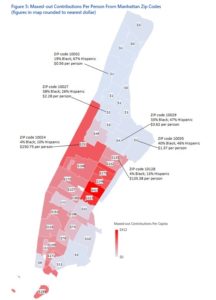
The top-giving Manhattan zip codes on a per capita basis was the aforementioned 10022, which provided $412 per person in maxed-out contributions in the past three election cycles. The residents of all Manhattan zip codes, combined, gave an average of $86 per person in maxed-out contributions.
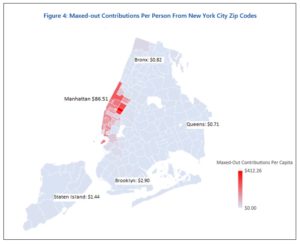
This contrasts starkly with New York City’s other four boroughs, which gave an average of $1.63 per person in maxed-out contributions. Among them, residents of Brooklyn gave $2.90 per person; Staten Island, $1.44; the Bronx, 82 cents; and Queens, 71 cents. [Figure 4]
While Manhattan zip codes provided more than 50 times more per person in maxed-out contributions as the other New York boroughs, maxed-out contributions within the borough still contrasted dramatically by zip code. Contrasts in maxed-out contributions were correlated with significant differences in the Black and Hispanic populations.
For example, zip code 10024, on the Upper West Side, has a combined Black and Hispanic population of 14 percent, and gave $251 per person in maxed-out contributions. Bordering zip code 10032 has a combined Black and Hispanic population of 86 percent, and gave just 56 cents per person in maxed-out contributions. In other words, the Upper West Side zip code provided nearly 450 times as much in per capita maxed-out contributions as the zip code with which it shares its northern border.
A similar but somewhat less stark contrast can be seen when comparing the northernmost Upper East Side Zip code with its neighbors to its north. None of Manhattan’s nine northernmost zip codes gave more than $3.33 a person. [Figure 5]
Seventeen New York City zip codes, with an average population of more than 43,000 apiece, did not provide a single maxed-out contribution in the past three election cycles. All but two of the zip codes lacking a maxed-out contribution are in the Bronx or Queens.
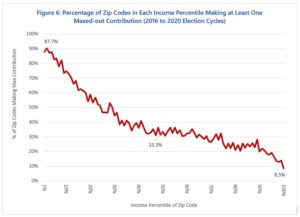
It is common for entire zip codes not to furnish maxed-out contributions. Out of 31,868 zip codes, nationwide, that are covered in this study, only 12,796 – or 40 percent – provided even one maximum contribution in the past three election cycles. The likelihood of a zip code furnishing a maximum contribution is closely correlated with the wealth of the zip code.
Nearly 88 percent of zip codes in the top income percentile provided at least one maximum contribution from 2016 to 2020. Only a third of zip codes at the 50th percentile did so, and less than 9 percent of zip codes in the poorest 1 percentile did so. [Figure 6]
The correlation in Figure 6 is somewhat exacerbated by the fact that populations tend to be smaller in less wealthy zip codes. But the dominance of the wealthiest 1 percent of zip codes remains striking after adjusting for population. When per capita maxed-out contributions are charted by each income percentile, zip codes below the 10th percentile of average income barely register. [Figure 7]
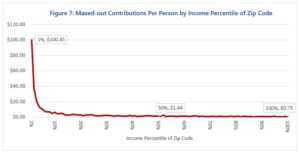
In Figure 7, above, differences in giving between most zip codes below the 10th income percentile are barely perceptible because giving from the wealthiest decile so dominates the others. But if the top decile is excluded, the resulting chart shows that giving is generally correlated with neighborhood wealth in income percentiles 11 to 100. Per capita maxed-out contributions steadily declined from $4.30 per person at the 11th percentile to 79 cents per person at the 100th percentile. [Figure 8]
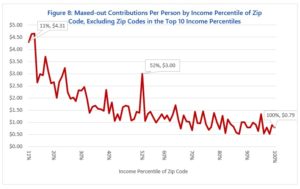
An exception to the general correlation between giving and zip code income percentile is apparent at income percentile 52 in Figure 8, above. It shows that giving from zip codes in the 52nd percentile, at $3 per person, is more than double giving from zip codes in the surrounding income percentiles.
That aberration is largely due to contributions by residents of zip code 49503 in Grand Rapids, Mich., and specifically from members of the DeVos family. These donors include Betsy DeVos, who was secretary of Education during the Trump administration.
About 20 DeVoses living in zip code 49503 combined to make $2.8 million in maxed-out contributions to candidates for Congress from the 2016 to 2020 election cycles. They accounted for 37 percent of maxed-out contributions among the 2.4 million people living in zip codes in the 52nd income percentile.
If nobody but the DeVoses provided maxed-out contributions from zip code 49503, that zip code would still rank 76th out of nearly 32,000 zip codes nationwide in cumulative maxed-out contributions.
The maxed-out contributions that members of the DeVos family made to congressional candidates were dwarfed by contributions they made to party committees, judicial candidates and unrestricted super PACs. An organization that tracks political spending in Michigan found that members of the DeVos family contributed more than $14 million to candidates, political parties and super PACs between 2015 and 2020.
Members of the DeVos family have been political megadonors for decades. In 1997, Betsy DeVos acknowledged that members of the family do, indeed, expect something in exchange for their contributions.
“I have decided, however, to stop taking offense at the suggestion that we are buying influence. Now I simply concede the point. They are right. We do expect some things in return,” DeVos wrote. “We expect to foster a conservative governing philosophy consisting of limited government and respect for traditional American virtues. We expect a return on our investment; we expect a good and honest government. Furthermore, we expect the Republican Party to use the money to promote these policies, and yes, to win elections.”
II. Zip Codes With Large Populations of People of Color Provide Very Few Maximum Contributions
The prevalence of maxed-out contributions is highly correlated with the racial composition of zip codes.
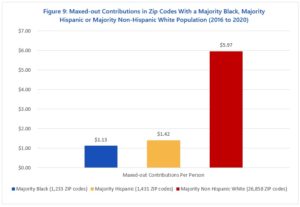
Zip codes that consist of more than 50 percent of people identifying themselves as white (non-Hispanic) provided an average of $5.97 per person in maxed-out contributions.
That was more than four times the maxed-out contributions given by people in zip codes with a majority Hispanic population and more than five times the amount given from zip codes with majority Black population. [Figure 9]
Consistent with the data in Figure 9, the maxed-out contributions are inversely proportional to the density of the Black population in a zip code. Zip codes with a Black population of no more than 5 percent gave an average of $6.49 per person. Zip codes with a Black population greater than 90 percent gave just 33 cents per person in maxed-out contributions. [Figure 10]

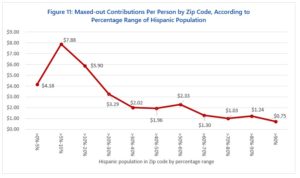
A similar dynamic is on display for zip codes according to their share of Hispanic population, although the correlation is not quite as consistent. [Figure 11]
Conclusion
Defenders of our campaign finance system argue that it limits the risk of corruption to acceptable levels by imposing caps on direct contributions. A few truly fervent supporters of the system rhapsodize that it fortifies our democracy by fostering more political speech.
But debating whether the system results in improper favors being made in exchange for contributions (which it undoubtedly does, at least to some extent) frames the question far too narrowly. This construct bypasses the more fundamental question of how reliance on wealthy donors determines the pool of viable candidates for Congress and, in turn, the views adopted by those candidates. Meanwhile, the “campaign contributions are democracy-enhancing speech” argument collapses when one takes into account that the only the wealthiest people are given a microphone.
A more inciteful way to evaluate the current system is to ask if members of Congress would govern differently if they were not concerned with appealing to the interests of particularly wealthy people to obtain and retain their seats.
Readers might test their answer by trying the following thought experiment: If members of Congress relied on people from the poorest 10 percent of neighborhoods – instead of the wealthiest 10 percent – for two-thirds of their maxed-out campaign contributions, would they be more responsive to the needs and wishes of poor neighborhoods? Anyone answering that question in the affirmative – as common sense all but demands – cannot reasonably avoid concluding that our campaign finance system has a corrupting effect.
The Freedom to Vote Act would not turn the system on its head by granting the poorest Americans a disproportionate role in financing campaigns, nor would it empower Americans to contribute equally without regard to their economic status. Even small contributions would remain onerous for many families.
But the possibility of receiving funding from a far broader cross section of the population would almost certainly enable many more people to put themselves forward as viable candidates to serve as our representatives.
And by enabling relatively small contributions to be leveraged with a generous public match, the bill would essentially grant many Americans of modest means a vote in the metaphorical fundraising primary that winnows the field of candidates we eventually choose from on Election Day.
Even ardent supporters of the current system might, in an honest moment, equate this to giving regular Americans a voice.
Methodology
Campaign contribution data was downloaded from the Federal Election Commission. Except where otherwise stated, maximum contribution figures in this study refer to contributions made to candidates for Congress in the 2016 to 2020 election cycles. Only contributions from individuals to the principal campaign committees of candidates for Congress were included.
Population and household income data was taken from the U.S. Census Bureau’s American Community Survey 5-Year Estimates Data Profiles published in 2019. The ACS data leaves some zip codes out because they contain few or no residential addresses. ACS does cover a small percentage of zip codes for which average household income data is not provided. They are excluded from this analysis.
This study captures data from 31,868 zip codes for which the ACS provides both population and income data. These zip codes had a combined population of 327.5 million people, representing 99.8 percent of the total U.S. population (328.2 million) that the Census Bureau separately reported in 2019.
Despite the fact that the ACS data covers (and provides income data from) more than 99 percent of the population, demographic data was not available for slightly more than $100 million in maxed-out contributions to members of Congress over the past three election cycles. These contributions equaled 6 percent of the total. The absence of demographic data was largely due to contribution records lacking zip codes or the contribution records listing nonresidential zip codes, which are not included in the ACS data.
Conclusions in this study assume that trends relating to the roughly $100 million in maxed-out contributions for which income data is not available are consistent with the other 94 percent of contributions.
[1] This calculation refers to instances in which a donor gave more than $200 to a single candidate for Congress in a single-contribution. Cases in which a donor gave more than $200 through multiple sub-$200 contributions were not captured. The campaign finance organization OpenSecrets estimates that about 720,000 individuals gave more than $200 in a single contribution to at least one congressional candidate in the 2020 election cycle. (E-mail from OpenSecrets to author (Jan. 12, 2022).)
[2] This calculation is based on a count of unique names within single zip codes making a maxed-out contribution to a candidate for Congress. This methodology likely results in an overcount because cases of individual donors giving under slightly different names (such as Phil and Phillip) or giving under different zip codes are counted as separate donors. But whether there were 85,000 maxed-out donors or, perhaps, 5 or 10 percent fewer does not change the general findings of this study, which is focused on the number of maxed-out contributions, not the number of discrete maxed-out contributors.
[1] Total Cost of Election (1998-2020), OpenSecrets (viewed on Jan. 7, 2022), https://bit.ly/3t7Mgbx
[2] Norah O’Donnell, Are members of Congress becoming telemarketers? CBS News (April 24, 2016), https://cbsn.ws/3GadHWa.
[3] Id.
[4] Joshua L. Kalla and David E. Broockman, Campaign Contributions Facilitate Access to Congressional Officials: A Randomized Field Experiment, American Journal of Political Science (July 2016), https://bit.ly/3q6RO4u.
[5] Jon Schwarz, Barack Obama Never Said Money Wasn’t Corrupting; In Fact, He Said The Opposite, The Intercept (April 15, 2016), https://bit.ly/33fXDDH.
[6] Did Money Win? OpenSecrets (viewed on Jan. 7, 2022), https://bit.ly/3n8Ndg3.
[7] Alan Zibel, Oligarch Overload: How Ultra-Rich Donors Have Flooded American Politics With Cash Since Citizens United Ruling, Public Citizen (Jan. 15, 2020), https://bit.ly/336mOcd.
[8] The Freedom to Vote Act, S. 2747, 117th Congress, https://bit.ly/3q40yIU.