Profits Over Patients
Spending on Self-Enrichment Exceeds Research and Development Costs for Many Manufacturers of IRA Drugs
By Jishian Ravinthiran
Executive Summary
The federal and state governments are taking significant steps to deliver much-needed drug pricing relief to millions of Americans. Measures include a historic provision in the Inflation Reduction Act allowing Medicare to negotiate prices for select drugs, draft executive guidance to license generic competition on taxpayer funded drugs, and state Prescription Drug Affordability Boards with the power to limit expenditures on drugs. But as governments rise to the challenge of tackling the decades long problem of excessive drug prices, the pharmaceutical industry raises significant opposition to insulate its profiteering from popular measures. Chief among their claims is that regulating drug prices will reduce industry profits, and thus capacity to invest in the research and development of new medicines. But that claim is belied by these corporations’ own expenditures on self-enriching activities, including stock buybacks, dividends to shareholders, and executive compensation, that far exceed their investments in innovation.
- The manufacturers of the first 10 drugs selected for Medicare price negotiation, in aggregate, spent $10 billion more on self-enriching activities than on research and development in 2022.
- For manufacturers of the 10 drugs with the highest expenditures by Maryland payers, including Medicare, Medicaid, and certain commercial insurance plans, companies spent $9 billion more on stock buybacks, dividends, and executive compensation than on research and development expenses in 2022.
- Executive compensation for the manufacturers of the drugs selected for Medicare price negotiation exceeded half a billion dollars in just 2022. The same is true for executive compensation for the manufacturers of the 10 costliest drugs in Maryland. Most of this compensation is keyed to stock prices, which incentivizes short-term measures to inflate share prices, such as stock buybacks, rather than long-term investments in researching and developing new drugs.
Introduction
Price gouging on essential medicines harms the health of millions of Americans every year. In 2021, approximately 9.2 million Americans were unable to take medications as prescribed due to costs.[1] People with disabilities were three times more likely to be unable to take medications as prescribed due to these cost barriers.[2] Nearly one in four uninsured Americans skipped doses, took less medication, or delayed filling a prescription because of costs.[3] Data from 2023 shows that three in ten Americans have not taken their medications as prescribed due to costs, 82% of Americans say the cost of prescription drugs is unreasonable, and 73% say that the government is not doing enough to regulate drug prices.[4]
Considering this drug pricing crisis, the federal and state governments have taken significant steps to make high-cost drugs more affordable and deliver relief for patients everywhere. Several states, starting with Maryland in 2019, have established Prescription Drug Affordability Boards, which are charged with analyzing the excessive costs of prescription drugs and identifying solutions to medicine inaccessibility. Four of these states—Colorado, Maryland, Minnesota, and Washington—have empowered their Boards to set upper payment limits for the purchase of certain prescription drugs.[5] At the federal level, Congressional Democrats passed and President Biden signed into law the Inflation Reduction Act, which includes a provision allowing Medicare Part D to negotiate the price of select drugs for the first time in the program’s 20-year history.[6] The law also capped the out-of-pocket costs for insulin at $35 per month for Medicare enrollees and annual out-of-pocket expenses for prescription drugs at $2,000.[7] More recently, the Biden administration announced draft guidance that would empower federal agencies to license generic competition to make taxpayer-funded medicines more affordable where drug manufacturers price the medicine excessively.[8]
The pharmaceutical industry has been staunchly opposed to popular reforms designed to constrain their unreasonable profiteering on medicines. The industry has criticized Prescription Drug Affordability Boards, the Inflation Reduction Act’s provisions on price negotiation, and the Biden administration’s framework for licensing generic competition on taxpayer funded medicines, with most concerns being funneled into the claim that any attempts to rein in their price-gouging tactics will impact the research and development of new medicines.[9]
That claim is flawed for several reasons. First, researchers and the Congressional Budget Office conclude there is no connection between a drug’s research and development cost and its future price.[10] Rather, the current price of drugs reflects what companies believe the market will bear in response to their monopolistic pricing power.[11] Second, compared to the rest of the globe, the United States is an outlier that does little to protect its residents from the unfair pricing power of drug companies,[12] and bringing American policy into alignment with those of other countries, including other high-income peers, will not destroy the incentive to innovate new medicines.
Finally, as this report will emphasize, pharmaceutical companies spend in excess on executive compensation, share buybacks, and dividends which enrich their shareholders, cutting against the industry’s mistaken impression that it is strapped for resources to research and develop new medicines.[13] Stock buybacks enrich investors by reducing the number of outstanding shares in a company. The fewer shares there are in investors’ hands, the more each share is worth. When a company buys back and cancels 10% of its shares, that makes each share still held by an investor or insider rise in value, as it represents a greater claim on the company’s earnings. Spending money this way allows companies to enrich shareholders silently, as well as the executives often paid in stock.[14] Dividends are another way of returning cash to investors. Each fiscal quarter, publicly traded companies typically issue fixed dividends to shareholders that rise when business is good and shrink or get suspended when business is bad.[15] Drug companies spend billions on stock buybacks and dividends to shareholders each year.[16]
A recent report by Protect Our Care shows that the drug companies marketing the drugs selected for the first round of Medicare price negotiation under the Inflation Reduction Act spent approximately $20 billion on stock buybacks and $54 billion on dividends to shareholders in 2023 as of November.[17] These excessive expenditures on share buybacks and dividends were also highlighted in a 2021 Drug Pricing Report from the House Oversight & Reform Committee, which found the industry argument “that permitting Medicare to negotiate drug prices would stifle innovation is not supported by available evidence or findings from the Committee’s multi-year investigation into the pharmaceutical industry.”[18] The investigation found that 14 large pharmaceutical companies spent $56 billion more on stock buybacks and dividends compared to research and development expenditures between 2016 and 2020.[19]
This report by Public Citizen and Protect Our Care highlights those findings and recenters the lavish expenditures of the manufacturers of the first 10 prescription drugs selected for Medicare price negotiations as industry renews claims that drug pricing relief will harm innovation. This report also examines the self-enriching activities of the manufacturers of the 10 drugs with the highest expenditures by payers in Maryland, which was the first state to establish a Prescription Drug Affordability Board. As other states consider passing similar legislation to create Prescription Drug Affordability Boards,[20] and as advocates in Maryland press for the expansion of its Board’s upper payment limit authority to help more residents,[21] this report shows that the expenditures for the costliest drugs at the state level mirror the excessive spending on self-enrichment at the national level. Ultimately, the data shows these companies are not strapped for resources: they spend billions more on executive compensation, stock buybacks, and dividends to shareholders than research and development activities.
Manufacturers of the Drugs Selected for Medicare Price Negotiation Spent Billions More on Dividends, Stock Buybacks, and Executive Compensation than Research & Development
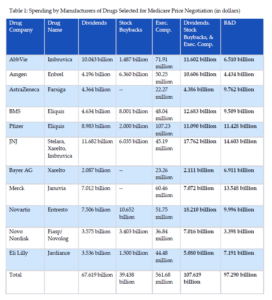
In August 2023, the Biden administration announced the first 10 drugs selected for Medicare price negotiation under the Inflation Reduction Act.[22] Between June 2022 and May 2023, these ten drugs cost Medicare Part D $50.5 billion.[23] The manufacturers of the drugs and relevant financial information obtained from Form 10-K, 20-F, and proxy statement filings with the Securities Exchange Commission (SEC), and publicly available accounting statements are listed in Table 1. Detailed methodology for all tables is contained in the Appendix. For example, Johnson & Johnson (JNJ) spent $11.682 billion on dividends to shareholders, $6.035 billion on stock buybacks, and $45 million on executive compensation in 2022. In total, JNJ spent $17.762 billion on these self-enriching activities compared to $14.6 billion on research and development.
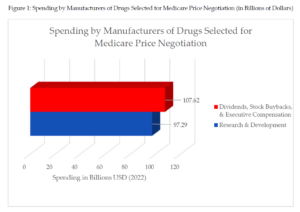
The manufacturers of the drugs selected for Medicare price negotiation spent $10 billion more on stock buybacks, dividends, and executive compensation than research and development in 2022. If the $12 billion in advertising expenditures are also included to show the significant resources at these companies’ disposal, manufacturers of drugs selected for Medicare price negotiation spent $22 billion more compared to research and development expenses.[24]
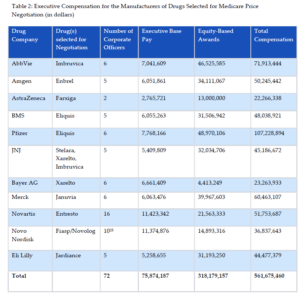
As shown in Table 2, executive compensation for these manufacturers exceeded half a billion dollars in just one year. More than half of executive compensation was based on equity awards, thereby directly linking executive pay to share price. The payment structure incentivizes share repurchases to inflate stock values, which increases executive compensation in the short-term.
In sum, these figures suggest that these drug corporations have ample resources to invest in research and development, which belies industry claims that the Medicare price negotiation provisions will stifle innovation.
Manufacturers of the Costliest Drugs in Maryland Spent Billions More on Dividends, Stock Buybacks, and Executive Compensation than Research & Development
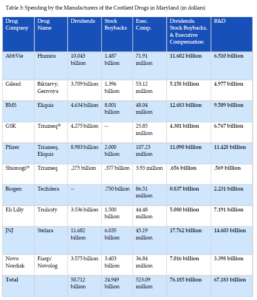
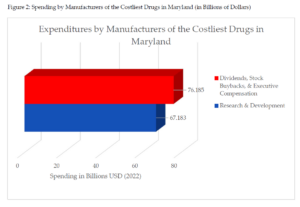
A similar pattern of corporate enrichment emerges for the 10 costliest drugs in Maryland. In 2022, Maryland’s Prescription Drug Affordability Board published a report that detailed the 10 drugs payers, including Medicare, Medicaid, and certain commercial insurance plans, spent the most on in 2019.[26] The manufacturers of those drugs and their respective spending on dividends, stock buybacks, executive compensation, and research and development are reported in Table 3 using securities filings and publicly available statements. These drug corporations spent $9 billion more on share repurchases, dividends to shareholders, and executive compensation than on research and development in 2022. When the $10 billion in advertising expenditures are included to illustrate the lack of resource constraints facing these companies, pharmaceutical manufacturers of the 10 costliest drugs in Maryland spent $19 billion more compared to research and development expenses.[27]
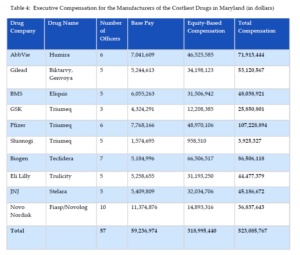
Like the manufacturers of the drugs selected for Medicare price negotiation, manufacturers of the ten costliest drugs in Maryland spent over half a billion dollars on executive compensation in just 2022 (see Table 4). For these companies, 60% of executive pay was based on equity awards, helping drive corporate investment in short-term measures to inflate stock values, such as stock buybacks, as opposed to long-term investments in research and development.
In sum, establishing state Prescription Drug Affordability Boards with the authority to limit the price of drug transactions or expanding these boards’ authority to deliver relief to more residents does not constrain industry capacity to invest in drug innovation. Drug companies of the costliest drugs in states, which are often the manufacturers of the costliest drugs nationally, have significant resources to invest in research and development.
Conclusion
Supermajorities of Americans believe that drug prices are unreasonable and that the government is doing too little to protect its residents from their excessive costs. As federal and state governments rise to the occasion and deliver relief from the price-gouging of their constituents, it is expected that the pharmaceutical industry will raise strong opposition to these efforts to preserve their profiteering. Most commonly, opposition to popular relief centers the claim that reducing their profits in any manner will constrain their resources to invest in new medicines.
As experts, advocates, scholars, and government oversight institutions have reiterated for years, those claims are belied by the lavish expenditures of these companies on activities to enrich their shareholders and executives, which outweigh their investment in the innovation of new drugs. Indeed, this rings true for the corporations manufacturing the first drugs selected for Medicare price negotiation and the costliest drugs in Maryland, with billions spent in excess of research and development expenses on dividends, stock buybacks, and executive compensation. As such, there is no necessary relationship between drug pricing relief for millions and harming resources for innovation, and arguments to the contrary must be contested wherever they abound.
Appendix: Methodology for Obtaining Financial Figures
Table 1: Spending by Manufacturers of Drugs Selected for Medicare Price Negotiation (in dollars)
Data was taken from the latest annual SEC filings for Fiscal Year 2022 of all U.S.-based companies. Advertising figures were taken from descriptive statements offered in these SEC filings.[30] Dividend and stock repurchase figures were taken from Consolidated Cash Flow Statements.[31] For two companies, there was a discrepancy between descriptive statements as to share repurchases in the SEC filings versus information in the cash flow statements on the purchases of treasury stock.[32] For consistency, this report uses the figures reported in the cash flow statements. Research and development figures were taken as reported in Consolidated Income/Earning Statements.[33] Foreign corporations AstraZeneca & Novartis filed Form 20-F with the SEC disclosing the instant data in similar formats, with the exception of advertising figures which do not appear to be descriptively reported.[34]
Research and development, stock repurchase, and dividend figures for Novo Nordisk were obtained from publicly available Income and Cash Flow statements in annual reports.[35] A similar approach was used for Bayer AG, a German company: this data was taken from its publicly available annual report for 2022.[36]
Executive compensation data was taken from the latest proxy statements filed with the SEC (Fiscal Year 2022) of all U.S.-based companies.[37] Figures on executive compensation were obtained from the Summary Compensation Table, which provides a total figure combining base salary, equity-based compensation, non-equity compensation according to the company’s incentive plan, appreciation in pension value, deferred compensation, and “other compensation,” which includes the cost of providing corporate travel, automobiles, and financial planning services.[38]
Foreign corporation AstraZeneca filed Form 20-F with the SEC, which incorporates by reference certain pages detailing remuneration from its annual report.[39] Novartis disclosed compensation figures for its Executive Committee in Form 20-F filed with the SEC.[40] Novo Nordisk disclosed executive compensation in its annual Remuneration Report.[41] Bayer AG included its executive compensation figures in its annual report.[42]
Data in foreign currencies were converted to U.S. dollars using the yearly average exchange rates for 2022 posted on the Internal Revenue Service’s website.[43]
Table 2: Executive Compensation for the Manufacturers of Drugs Selected for Medicare Price Negotiation (in dollars)
Executive compensation data was obtained using the approach outlined for Table 1. For U.S. based companies, stock-based and option-based awards were aggregated from the Summary Compensation Table to establish equity-based compensation for executives.[44] Foreign corporations often did not detail equity-based compensation in the same manner. They disclosed equity-based compensation in a category termed long-term incentive programs/awards.[45] Base salary was disclosed in a standard manner across companies.[46]
Again, data in foreign currencies were converted to U.S. dollars using the yearly average exchange rates for 2022 posted on the Internal Revenue Service’s website.[47]
Table 3: Spending by the Manufacturers of the Costliest Drugs in Maryland (in dollars)
Research and development, stock buybacks, dividend payments, and total executive compensation figures were obtained using the same approach from Table 1. The following manufacturers of the drugs selected for Medicare price negotiation also appeared on the list of manufacturers of the 10 costliest drugs in Maryland: AbbVie, Bristol Myers Squibb, Pfizer, Eli Lilly, Johnson & Johnson, and Novo Nordisk. Therefore, the same data was used from Table 1.
Gilead and Biogen’s data on stock repurchases, dividends, and research and development figures were obtained from Consolidated Cash Flow Statements and Income/Earning Statements in their 2022 Form 10-K filing with the SEC.[48] Advertising figures for these companies were taken from the descriptive statements within these filings.[49] GSK filed Form 20-F with the SEC disclosing data on research and development, stock repurchases, and dividends.[50] Shionogi is a Japanese company that operates on a fiscal year from April 1, 2022, through March 31, 2023. To examine figures from 2022, data for research and development, stock repurchases, and dividends was taken from its third quarter report covering April 1, 2022, through December 31, 2022.[51]
Executive compensation figures for Gilead and Biogen were disclosed in their proxy statement filings with the SEC.[52] For GSK, this data was obtained from its annual report incorporated by reference in its Form 20-F filing with the SEC.[53] Shionogi discloses executive compensation according to its fiscal calendar, so the latest disclosure covering Fiscal Year 2022 covered April 1, 2022, through March 31, 2023.[54]
Data in foreign currencies were converted to U.S. dollars using the yearly average exchange rates for 2022 posted on the Internal Revenue Service’s website.[55]
Table 4: Executive Compensation for the Manufacturers of the Costliest Drugs in Maryland (in dollars)
Executive compensation data was obtained using the approach outlined for Table 3. The following manufacturers of the drugs selected for Medicare price negotiation also appeared on the list of manufacturers of the 10 costliest drugs in Maryland, so their executive compensation figures from Table 2 were used: AbbVie, Bristol Myers Squibb, Pfizer, Eli Lilly, Johnson & Johnson, and Novo Nordisk.
Again, for U.S.-based companies, stock-based and option-based awards were aggregated to determine equity-based compensation for executives.[56] Equity-based compensation fell under the category of long-term incentive awards for GSK executives.[57] Shionogi disclosed stock-based compensation under a category termed “non-monetary remuneration.”[58] Base salary data was disclosed in a standard manner across companies.[59]
Data in foreign currencies were converted to U.S. dollars using the yearly average exchange rates for 2022 posted on the Internal Revenue Service’s website.[60]
References
[1] Laryssa Mykyta, and Robin A. Cohen, Centers for Disease Control and Prevention, National Center for Health Statistics, Characteristics of Adults Aged 18–64 Who Did Not Take Medication as Prescribed to Reduce Costs: United States, 2021, NCHS Data Brief No. 470 (June 2023).
[2] Id. at 2.
[3] Id. at 3.
[4] Ashley Kirzinger, Alex Montero, Grace Sparks, Isabelle Valdes, & Liz Hamel, Public Opinion Prescription Drugs and Their Prices, KFF (Aug. 21, 2023), https://www.kff.org/health-costs/poll-finding/public-opinion-on-prescription-drugs-and-their-prices/.
[5] See e.g., CO. Senate Bill 21-175, Sec. 10-16-1407; Md. Code, Health-Gen. § 21-2C-14; Minn. Sess. L. 2023 Ch. 57, art. 2, Sec. 35; Rev. Code Wash. 70.405.050.
[6] The White House, FACT SHEET: Biden-Harris Administration Announces First Ten Drugs Selected for Medicare Price Negotiation, Statements & Releases (Aug. 29, 2023), https://www.whitehouse.gov/briefing-room/statements-releases/2023/08/29/fact-sheet-biden-harris-administration-announces-first-ten-drugs-selected-for-medicare-price-negotiation/.
[7] Centers for Medicare & Medicaid, Anniversary of the Inflation Reduction Act: Update on CMS Implementation, CMS.gov (Aug. 16, 2023), https://www.cms.gov/newsroom/fact-sheets/anniversary-inflation-reduction-act-update-cms-implementation.
[8] NIST Releases for Public Comment Draft Guidance on March-In Rights, https://www.nist.gov/news-events/news/2023/12/nist-releases-public-comment-draft-guidance-march-rights (last visited Dec. 12, 2023).
[9] See PhRMA, States Can Help Patients Pay Less for Their Medicines, State Policies and issues, https://phrma.org/en/States (last visited Jan. 11, 2023); PhRMA, Inflation Reduction Act’s Unintended Consequences,https://phrma.org/inflation-reduction-act?utm_campaign=2024-q1-pri-v6&utm_medium=pai_srh_cpc-ggl-adf&utm_source=ggl&utm_content=clk-pat-v6-v6-v6-all-pai_srh_cpc-ggl-adf-IRAEvergreenSearchWCNational1-evg-v6-v6-lrm-soc_txt-v6-vra-adf&utm_term=inflation%20reduction%20act&utm_campaign=&utm_source=adwords&utm_medium=ppc&hsa_acc=8523309176&hsa_cam=20882819512&hsa_grp=158617381844&hsa_ad=685220095153&hsa_src=g&hsa_tgt=kwd-1705916798609&hsa_kw=inflation%20reduction%20act&hsa_mt=b&hsa_net=adwords&hsa_ver=3&gad_source=1&gclid=Cj0KCQiAwP6sBhDAARIsAPfK_wZ3PhDU-6cvBxNUI9JVXtfl-nZch3LOEQIJQA2j_rY2LRRBqHdL7fQaAkKjEALw_wcB (last visited Jan. 11, 2024); PhRMA Statement on Proposed March-In Framework , PhRMA (Dec. 6, 2023), https://phrma.org/resource-center/Topics/Access-to-Medicines/PhRMA-Statement-on-Proposed-March-In-Framework.
[10] Congressional Budget Office, Research and Development in the Pharmaceutical Industry (Aug. 2021) (“In CBO’s assessment, current R&D spending does not influence the future prices of the drugs that result from that spending.”); Aaron Kesselheim, Jerry Avorn, & Ameet Sarpatwari, The High Cost of Prescription Drugs in the United States: Origins and Prospects for Reform, 316 JAMA Network 858 (2016); Vinay Prasad, Kevin De Jesus, Sham Mailankody, The high price of anticancer drugs: origins, implications, barriers, solutions, 14 Nat. Rev. Clin. Onc. 381 (2016).
[11] Aaron Kesselheim, Jerry Avorn, & Ameet Sarpatwari, The High Cost of Prescription Drugs in the United States: Origins and Prospects for Reform, 316 JAMA Network 858 (2016).
[12] Amy Kapczynski, The Political Economy of Market Power in Pharmaceuticals, 48 J. Health Pol., Pol’y & L. 215 (2023); S. Vincent Rajkumar, The high cost of prescription drugs: causes and solutions, 10 Blood & Cancer J. 381 (2020).
[13] Amy Kapczynski, The Political Economy of Market Power in Pharmaceuticals, 48 J. Health Pol., Pol’y & L. 215, 230 (2023) (citing Aaron Kesselheim & Jeffrey Avorn, Letting the Government Negotiate Drug Prices Won’t Hurt Innovation, Wash. Post (Sept. 27, 2021), https://www.washingtonpost.com/outlook/2021/09/22/drug-pricing-negotiation-biden-bill/); U.S. House of Representatives’ Committee on Oversight & Reform, Drug Pricing Investigation: Industry Spending on Buybacks, Dividends, & Executive Compensation (July 2021).
[14] Public Citizen, Bailout Watch, Friends of the Earth, Big Oil’s Wartime Bonus 2 (2022).
[15] Id. at 8.
[16] Protect Our Care, Greed Watch: Big Companies Continue to Bring in Billions While Americans Struggle to Afford Skyrocketing Prices 4 (Nov. 2023), GREED-WATCH-Big-Drug-Companies-Continue-To-Bring-In-Hundreds-of-Billions-While-Americans-Struggle-To-Afford-Skyrocketing-Prices.pdf (protectourcare.org).
[17] Id.
[18] U.S. House of Representatives’ Committee on Oversight & Reform, Drug Pricing Investigation: Industry Spending on Buybacks, Dividends, & Executive Compensation 11 (July 2021).
[19] Id. at 3.
[20] Drew Gattine & Jennifer Reck, State House Wrap-Up: States Continue to Tackle High Prices in 2023 Session, Nat. Acad. State Health Pol’y Blog (Oct. 30, 2023), https://nashp.org/state-house-wrap-up-states-continue-to-tackle-high-drug-prices-in-2023-session/.
[21] Daniel J. Brown, Health care legislation preview: Maryland advocates want to focus on access, patients in 2024 session, Maryland Matters (Jan. 8, 2024), https://www.marylandmatters.org/2024/01/08/health-care-legislation-preview-maryland-advocates-want-to-focus-on-access-patients-in-2024-session/.
[22] HHS Selects the First Drugs for Medicare Drug Price Negotiation, HHS.gov (Aug. 23, 2023), https://www.hhs.gov/about/news/2023/08/29/hhs-selects-the-first-drugs-for-medicare-drug-price-negotiation.html.
[23] Id.
[24] Manufacturers of the first drugs selected for Medicare negotiation spent 12.241 on advertising according to disclosures in Form 10-K filings with the SEC.
[25] According to Novo Nordisk’s Remuneration Report 2022, there is a category for non-registered executives, which includes 3 named persons. It remains unclear if other individuals are included in this category as well.
[26] Maryland Prescription Drug Affordability Board, Section 21-2c-09(c) (2022) Annual Cost Review Report 7 (Dec. 31, 2022).
[27] Manufacturers of the 10 costliest drugs in Maryland spent 10.032 billion on advertising expenses in 2022 according to disclosures in Form 10-K filings with the SEC.
[28] Triumeq is marketed by Viiv Healthcare, which is a joint venture between Pfizer, GSK, and Shionogi.
[29] Shionogi is a Japanese company that operates on a fiscal year from April 1, 2022 through March 31, 2023. Instead, data for this company on stock buybacks, dividends, and research and development was taken for April 1, 2022 through December 31, 2022 (9 months). However, executive compensation figures are only available on a yearly basis, so that information is taken from the 2022 report spanning April 1, 2022 through March 31, 2023.
[30] See e.g., AbbVie 2022 Form 10-K, at 57.
[31] See e.g., AbbVie 2022 Form 10-K, at 54.
[32] AbbVie describes that it repurchased $1.1 billion in stocks for 2022, but its cash flow statement shows it expended $1.487 billion on the purchase of treasury stock. Compare AbbVie 2022 Form 10-K, at 42 to AbbVie Form 10-K, at 54. Novartis described that it spent $10.8 billion on share repurchases, but its cash flow statement shows that it spent $10.652 billion on the acquisition of treasury stock. Compare Novartis 2022 Form 20-F, at 79 to Novartis 2022 Form 20-F, at F-5. These discrepancies do not affect the findings of this report.
[33] See e.g., AbbVie 2022 Form 10-K, at 50.
[34] AstraZeneca PLC, 2022 Form 20-F, at F-2, F-5, F-46 (“No share repurchases have been made since 2012”); Novartis, 2022 Form 20-F, at F-1, F-4,
[35] novo nordisk, Annual Report 2022 54-55 (2023).
[36] Bayer Annual Report 2022 2, 87, 90-91, 150 (2023).
[37] See e.g., AbbVie, 2023 Proxy Statement, at 51.
[38] Id.
[39] AstraZeneca, 2022 Form 20-F at 40; AstraZeneca Annual Report and Form 20-F Information 2022 111 (2023).
[40] Novartis, 2022 Form 20-F, at 105.
[41] Novo Nordisk, Remuneration Report 2022 12 (2023).
[42] Bayer Annual Report 2022 280-81 (2023).
[43] Yearly Average Currency Exchange Rates, IRS.gov, https://www.irs.gov/individuals/international-taxpayers/yearly-average-currency-exchange-rates (last visited Jan. 8, 2023).
[44] See e.g., AbbVie, 2023 Proxy Statement, at 51.
[45] AstraZeneca Annual Report and Form 20-F Information 2022 111 (2023); Bayer Annual Report 2022 280-81 (2023); Novo Nordisk, Remuneration Report 2022 12-14 (2023).
[46] See e.g., AbbVie, 2023 Proxy Statement, at 51; AstraZeneca Annual Report and Form 20-F Information 2022 111 (2023); Bayer Annual Report 2022 280-81 (2023); Novo Nordisk, Remuneration Report 2022 12 (2023).
[47] Yearly Average Currency Exchange Rates, IRS.gov, https://www.irs.gov/individuals/international-taxpayers/yearly-average-currency-exchange-rates (last visited Jan. 8, 2023).
[48] See Gilead, 2022 Form 10-K, at 49, 52; Biogen 2022 Form 10-K, at F-2, F-5.
[49] See Gilead, 2022 Form 10-K, at 55; Biogen 2022 Form 10-K, at F-21.
[50] See GSK, 2022 Form 20-F, at 16, 34-35.
[51] See Shionogi, Consolidated Financial Results for the Third Quarter Fiscal Year 2022 (IFRS) 4,10 (Jan. 30, 2023).
[52] See Gilead, Schedule 14A: 2023 Notice of Annual Meeting and Proxy Statement, at 69; Biogen, Schedule 14A: 2023 Annual Notice of Stockholders and Proxy Statement, at 56.
[53] See GSK, 2022 Form 20-F, at 51; GSK Annual Report 2022 136 (2023).
[54] See Shionogi, Chapter 3: Mechanisms Supporting SHIONOGI’s Growth, from Integrated Report 2023, at 93.
[55] Yearly Average Currency Exchange Rates, IRS.gov, https://www.irs.gov/individuals/international-taxpayers/yearly-average-currency-exchange-rates (last visited Jan. 8, 2023).
[56] See Gilead, Schedule 14A: 2023 Notice of Annual Meeting and Proxy Statement, at 69; Biogen, Schedule 14A: 2023 Annual Notice of Stockholders and Proxy Statement, at 56.
[57] GSK Annual Report 2022 136, 142 (2023).
[58] See Shionogi, Chapter 3: Mechanisms Supporting SHIONOGI’s Growth, from Integrated Report 2023, at 93.
[59] Gilead, Schedule 14A: 2023 Notice of Annual Meeting and Proxy Statement, at 69; Biogen, Schedule 14A: 2023 Annual Notice of Stockholders and Proxy Statement, at 56; GSK Annual Report 2022 136 (2023); Shionogi, Chapter 3: Mechanisms Supporting SHIONOGI’s Growth, from Integrated Report 2023, at 93.
[60] Yearly Average Currency Exchange Rates, IRS.gov, https://www.irs.gov/individuals/international-taxpayers/yearly-average-currency-exchange-rates (last visited Jan. 8, 2023).