The Big Ugly Threat to Safety Net Hospitals
Analyzing the hospitals put most at-risk by the Republican tax and budget reconciliation bill
By Eileen O'Grady
On July 4, 2025, President Trump signed a Republican budget reconciliation package into law that will decimate affordable health care for millions of Americans and risk the closure of rural hospitals. The One Big Beautiful Bill Act, which opponents of the law nicknamed the Big Ugly Law (BUL), will cut $911 billion in federal spending on Medicaid and CHIP over the next 10 years, according to estimates from the Congressional Budget Office. Draconian work and eligibility requirements for Medicaid recipients mean that millions of people will lose their Medicaid coverage.[1]
The cuts will be devastating to many low-income and disabled individuals who rely on Medicaid. Moreover, they will have knock-on effects on hospitals that disproportionately serve these communities, deepening the financial strain already plaguing rural and safety-net hospitals and compromising their ability to deliver care, potentially leading many to close.
This report identifies and analyzes the hospitals that are most at risk of closing, reducing the medical services they provide, or laying off workers due to Medicaid cuts imposed by the Big Ugly Law.
Our key findings include:
- 446 hospitals are at heightened risk of closing or reducing services due to Medicaid cuts.
- These hospitals collectively have approximately 69,000 beds and served approximately 6.6 million patients in 2024. They employ approximately 275,000 direct patient care workers.
- The communities served by these hospitals have a larger share of Black and Hispanic residents, as well as people living below the poverty line, compared to other hospitals. Nearly 20% of the at-risk hospitals (85) serve high-poverty areas.
- 267 (60%) of the at-risk hospitals serve urban areas, and 176 (39%) are rural hospitals.
- House Republicans who voted for Medicaid cuts have 196 at-risk hospitals in their districts collectively, and Senate Republicans (all of whom voted for Medicaid cuts) collectively have 146 at-risk hospitals in their states. Republicans also represent several of the congressional districts with the highest number of at-risk hospitals.
- Five states now have over a quarter of all their hospitals at risk: Connecticut, California, New York, Massachusetts, and Washington.
- Almost half of the at-risk hospitals have special Medicare payment designations that are typically associated with hospitals that are rural or financially vulnerable and play a critical role in the communities they serve, including Critical Access Hospital (19%), Rural Referral Center (16%), Sole Community Hospital (9%), and Medicare Dependent Hospital (4%).
- In recent months, hospitals have initiated layoffs and reduced services like obstetrics and maternal care, citing financial strain imposed by Medicaid cuts.
- The full list of at-risk hospitals is available at the end of this report (or click here).
Hundreds of Hospitals Serving Almost 7 Million Patients Face Increased Risk of Closing or Reducing Care
We identified 446 hospitals that are at heightened risk due to Medicaid cuts.
For this analysis, hospitals are considered at risk if they have both of the following factors:
- Medicaid, SCHIP, and Low Income Government Program Payer Mix is 20% or greater of a hospital’s payer mix (percentage of revenue coming from different types of payers), on average, from 2022 through 2024.
- The hospital has negative net profit margins, on average, for 2022-2024.
This approach is consistent with similar studies that have sought to identify at-risk hospitals. For example, a June 2025 analysis by the University of North Carolina’s Cecil G. Sheps Center identified rural hospitals with a top-10% Medicaid payer mix across the US and three consecutive years of negative margins.[2] Harvard’s Healthcare Quality and Outcomes Lab identified hospitals with a Medicaid payer mix of greater than 25%, financial distress, and safety-net or critical access hospital status.[3] This report builds on and expands these studies by analyzing the demographic and economic characteristics of the communities served by these hospitals, which provide insight into the potential downstream effects of hospital closures or service cuts.
This analysis includes two types of Medicare-designated hospital facilities: Short-term (General and Specialty) Hospitals and Critical Access Hospitals. It does not include other hospital facility types, such as psychiatric hospitals, children’s hospitals, long-term hospitals, or rehabilitation hospitals.
We use hospital financial data for 2022 through 2024, the most recent available from the Centers for Medicare and Medicaid Services (CMS). This includes approximately 95% of US hospitals; we excluded from our analysis hospitals with insufficient data and those that have closed since the period covered by the data. For a detailed description of our methods and sources, see the Methodology at the end of this report.
The list of at-risk hospitals is meant to be descriptive rather than predictive; it does not forecast that these hospitals will close, but rather identifies the hospitals most financially at risk from severe Medicaid cuts.
It is important to note that many more hospitals in the US are at risk of closing due to a variety of factors, including financial performance, declining patient volumes resulting from reduced services and workforce challenges, poor management practices, and conflicting ownership interests (such as investor-owned hospitals).[4] Our analysis focuses on hospitals that are at heightened risk as a direct result of the Big Ugly Law.
Hospital & Community Characteristics
These 446 at-risk hospitals collectively have 68,986 beds and served approximately 6.6 million patients in 2024. They employ approximately 275,458 direct patient care workers (this does not include non-medical workers, such as administrative staff).
Using census data to identify community demographics for each hospital,[5] We found that the communities served by these at-risk hospitals have a larger share of Black and Hispanic residents, as well as people living below the poverty line, than other hospitals. At-risk hospitals served communities that were 20% Hispanic and 13% Black, on average. For all other hospitals, the communities served were 13% Hispanic and 9% Black.
At-risk hospitals’ service areas also have a larger share of people living below the poverty line (16%) compared to other hospitals (13%). Nearly 20% of the at-risk hospitals (85) serve high-poverty areas.[6]
Table 1: Community Characteristics
| At-Risk Hospitals | All Other Hospitals | Difference | |
| % Hispanic | 20.2% | 13.0% | 7.2% |
| % Non-Hispanic Black | 13.3% | 8.9% | 4.4% |
| % population below poverty line | 15.8% | 13.4% | 2.4% |
| % of population with a disability | 15.8% | 15.4% | 0.4% |
| % College educated (some college or associate’s degree) | 29.3% | 30.5% | -1.2% |
| Median household income | $71,214 | $72,528 | -$1,314 |
Table 1 shows average characteristics for hospital service areas in two categories (“at-risk” hospitals and all other hospitals) based on data from the American Community Survey for 2023. For more information on methods, see the methodology at the end of this report.
Geographic Spread & Congressional Districts
In total, 267 hospitals (60%) of the at-risk hospitals are urban, and 176 hospitals (39%) are rural as defined by the Federal Office of Rural Health Policy (FORHP).[7]
While rural hospitals do face significant financial strain across the country, a growing body of research reveals increasing numbers of urban hospital closures.[8] A 2025 study by the Government Accountability Office (GAO) found that “Approximately half of U.S. hospitals are in urban areas, and closures of urban hospitals outpaced new openings from 2019 to 2023.”[9] Like rural hospitals, urban hospital closures can have especially profound impacts in socioeconomically disadvantaged communities, including decreased availability of essential health care services like emergency care, obstetrics, and inpatient care, exacerbated strain on nearby hospitals, which inhibits their ability to provide care, and health care worker layoffs (which can be especially big since hospitals are often major employers).
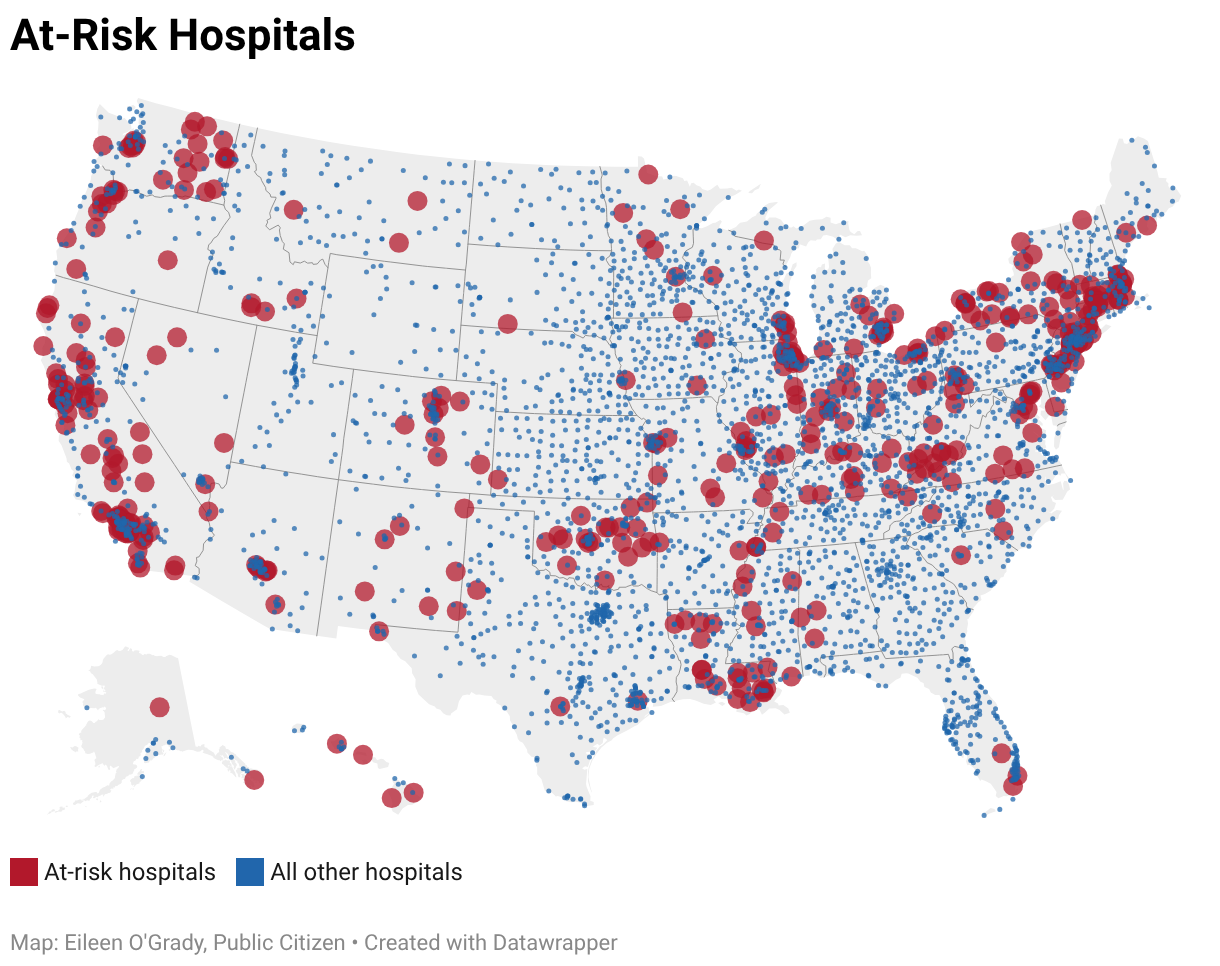
At-risk hospitals are spread throughout the country; we identified at least one at-risk hospital in 44 states and DC.
The states with the highest number of at-risk hospitals were California (83), New York (45), Illinois (28), and Washington (22).
When compared to a state’s total number of hospitals for which there is sufficient data available, states with the highest proportion of at-risk hospitals are Connecticut (36%), California (31%), New York (31%), Massachusetts (27%), and Washington (26%)
It is notable that while there are more at-risk hospitals in Democrat-led states and congressional districts, a substantial number of hospitals in Republican-led states and congressional districts are threatened by Medicaid cuts. Almost all congressional Republicans voted to pass the Big Ugly Law.
House Republicans who voted for Medicaid cuts have 196 at-risk hospitals in their districts, and Senate Republicans (all of whom voted for Medicaid cuts) have 146 at-risk hospitals in their states.[10]
Republicans also represent several of the congressional districts with the highest number of at-risk hospitals.
Table 2: Congressional Districts with Most At-Risk Hospitals
| Representative | Voted for the Big Ugly Law | Congressional District | # of At-Risk Hospitals |
| Josh Brecheen (R) | Y | OK-2 | 8 |
| Michael Baumgartner (R) | Y | WA-5 | 8 |
| Frank Lucas (R) | Y | OK-3 | 7 |
| Dan Newhouse (R) | Y | WA-4 | 7 |
| Carol Miller (R) | Y | WV-1 | 7 |
| Jared Huffman (D) | N | CA-2 | 6 |
| Mike Johnson (R) | Y | LA-4 | 6 |
| Jonathan Jackson (D) | N | IL-1 | 6 |
| Robert Menendez (D) | N | NJ-8 | 5 |
| Nancy Pelosi (D) | N | CA-11 | 5 |
| Doug LaMalfa (R) | Y | CA-1 | 5 |
| J. Correa (D) | N | CA-46 | 5 |
| Richard Neal (D) | N | MA-1 | 5 |
| Teresa Leger Fernandez (D) | N | NM-2 | 5 |
| Elise Stefanik (R) | Y | NY-21 | 5 |
| Nicholas Langworthy (R) | Y | NY-23 | 5 |
Medicare Payment Types
Almost half of the at-risk hospitals (215 out of 446 hospitals) have special Medicare payment designations that provide alternative payment models for federal reimbursements. Hospitals that carry these designations are often rural or financially vulnerable and play a critical role in the communities they serve. This includes:[11]
- Critical Access Hospitals (CAH): rural hospitals with at most 25 beds that are more than 35 miles from other facilities (with exceptions).
- Medicare Dependent Hospitals (MDH): small rural hospitals with a high share of inpatient Medicare charges.
- Sole Community Hospitals (SCH): hospitals that are the only source of short-term, acute inpatient care in a region.
- Rural Referral Centers (RRC): hospitals that generally either treat patients from across a large region or treat complex cases – not necessarily located in rural areas.
Table 3: Breakdown of CMS Payment Designations
| Payment Type | At-Risk Hospitals | % of At-Risk Hospitals |
| Critical Access Hospital | 84 | 18.6% |
| Rural Referral Center | 72 | 16.0% |
| Sole Community Hospital | 42 | 9.3% |
| Medicare Dependent Hospital | 17 | 3.8% |
| No special designation/not available | 231 | 51.2% |
These payment designations provide hospitals with a range of payment structures that may mitigate some of the risk posed by Medicaid cuts. For example, Medicare pays 101% of inpatient and outpatient costs for Critical Access Hospitals.
But while enhanced Medicare payments may provide some financial cushion for these hospitals, such designations also underscore the hospitals’ critical importance to the communities they serve. When a community’s only hospital cuts services or shutters completely, the consequences for that community could be catastrophic.
Service Cuts & Layoffs
The brunt of the Big Ugly Law’s impacts on hospitals will take time to play out, but recent service cuts and layoffs may be harbingers of what is to come.
Several of the examples below include hospitals that did not meet our criteria for designation as “at-risk,” even when hospital spokespeople explicitly cited reduced Medicaid revenue as reasons for their service cuts and layoffs. This suggests that the effects of the law will extend beyond the hospitals that appear most vulnerable.
In December 2025, Alameda Health System in Oakland, CA, announced that it would lay off nearly 300 employees due to Medicaid cuts in the Big Ugly Law. The health system is projected to lose more than $100 million annually by 2030.[12]
In January, Erie County Medical Center in Buffalo announced layoffs and unpaid furloughs of hospital staff, explicitly citing Medicaid cuts as a reason for the financial strain. It is the only Level 1 Trauma Center in the region.[13]
In the same month, Teton Valley Health in Idaho announced it would lay off workers and close a clinic, citing Medicaid cuts among the reasons for the decision.[14] And Trinity Health System, which operates 92 hospitals, announced that it will lay off 10.5% of its revenue cycle management staff across 15 states, noting that “recent and future government funding policy changes” could lower its annual revenue by $1.5 billion.[15]
Obstetric care, care focused on pregnancy, childbirth, and postpartum care—already severely under strain[16]—has taken significant hits in recent months. In announcing the decision to end maternal health services in November, hospital leadership for St. Mary’s Sacred Heart in rural Georgia wrote: “Changing demographics in our region, physician recruitment challenges, increasing outmigration for labor and delivery services, and recent Congressional cuts to Medicaid solidified this decision.”[17]
In December, Farmville, VA-based Centra Southside Community Hospital closed labor and delivery and OBGYN surgical services, as well as outpatient care with its affiliated women’s center. A press release announcing the closures noted that it “like other rural health care providers, must adapt to significant financial and operational challenges, including recently enacted reductions in federal health care funding.”[18]
In January 2026, Greene County General Hospital in Linton, IN, ended its obstetrics services. [19] Hospital CEO Brenda Reetz said in a statement published by the Indiana Hospital Association: “We could no longer sustain the OB unit because Medicaid and commercial insurance pay so far below the actual cost of care….This was a heartbreaking decision for our community. No hospital wants to cut services, but when reimbursement fails to cover even basic operating costs, we are left with no choice.”[20]
Conclusion & Recommendations
The Big Ugly Law is an unprecedented assault on health care access for millions of Americans, particularly people who are low-income, disabled, or elderly. The impacts will be widely felt, including hospitals that already face financial strain and serve a disproportionate share of Medicaid patients. If those hospitals close, lay off staff, or cut down on services to make up for the losses, it will be the communities they serve that pay the price.
In response to fears about the impacts of Medicaid cuts, Congress made some token attempts to add provisions to the law that would soften the blow. For example, in response to bipartisan concerns about the viability of rural hospitals, Congress added a $50 billion Rural Health Fund that will be distributed to states to “stabilize and strengthen rural hospitals and providers.”[21] However, while the fund may provide a cushion for some rural hospitals, there is significant uncertainty about whether it will be enough to stave off closures—$50 billion is a little over one-third (37%) of the estimated loss of federal Medicaid funding in rural areas.[22] And the haphazard way the funding is being disbursed means many hospitals are unlikely to receive any relief.
In the short term, Congress should take urgent action to restore all Medicaid funding cuts enacted by the Big Ugly Law and to extend the enhanced premium tax credits for coverage through the Affordable Care Act marketplaces. In the long term, Congress should work towards passing Medicare for All, which would ensure consistent funding for hospitals and other institutions through global budgets aligned with community needs.
Methodology
The hospital list is compiled from cost report data from the Centers for Medicare and Medicaid Services (CMS), provided by the National Academy for State Health Policy’s (NASHP) Hospital Cost Tool (HCT). Financial data is derived from cost reports from 2022 through 2024 (financial data for 2025 is not yet available) and includes 4,468 total hospitals.[23]
The NASHP HCT dataset includes two types of Medicare-designated hospital facilities: Short-term (General and Specialty) Hospitals and Critical Access Hospitals. It does not include other hospital facility types, such as psychiatric hospitals, children’s hospitals, long-term hospitals, or rehabilitation hospitals.
For our analysis, we excluded hospitals with missing or insufficient financial data and those that closed during the period covered by the data (together, 227 hospitals), leaving 4,241 hospitals in the universe we analyzed. This represents 95% of all US acute care hospitals.
We define “high-risk” hospitals as those with both of the following two indicators:
- Medicaid, SCHIP, and Low Income Government Program Payer Mix is 20% or greater of a hospital’s payer mix, on average, from 2022 through 2024.
- The hospital had negative net profit margins, on average, from 2022 through 2024.
Community demographic and economic data are based on the US Census Bureau’s American Community Survey for 2023. We used the Agency for Healthcare Research and Quality’s (AHRQ) Community-Level Health (CLH) database, which provides community-level variables across domains and links ZIP Code Tabulation Areas (ZCTA) to postal ZIP codes.[24]
To estimate the populations served by each hospital, we created Hospital Service Areas (HSAs) based on the CMS Hospital Service Area dataset (2024).[25] This dataset contains the number of Medicare cases by hospital provider number and the ZIP code of the Medicare beneficiary. We matched aggregated census data from the AHRQ CLH dataset across all ZIP codes in each HSA. Census variables are weighted by the number of Medicare cases in each ZIP code to provide population-weighted averages.
We used the Federal Office of Rural Health Policy (FORHP) rural/urban designations to determine rurality for each hospital, provided by the Cecil G. Sheps Center for Health Services Research. We also derived CMS payment designations from the Sheps Center dataset.[26]
List of At-Risk Hospitals
Click “view larger version” to expand table.
Sources
[1] Congressional Budget Office, Estimated Budgetary Effects of Public Law 119-21, to Provide for Reconciliation Pursuant to Title II of H. Con. Res. 14, Relative to CBO’s January 2025 Baseline. https://www.cbo.gov/publication/61570 ; Rhiannon Euhus, Elizabeth Williams, Alice Burns, and Robin Rudowitz, “Allocating CBO’s Estimates of Federal Medicaid Spending Reductions Across the States: Enacted Reconciliation Package,” KFF, July 23, 2025. https://www.kff.org/medicaid/allocating-cbos-estimates-of-federal-medicaid-spending-reductions-across-the-states-enacted-reconciliation-package/
[2] Letter from Senator Ed Markey to Donald Trump, John Thune, and Mike Johnson. June 12, 2025. https://www.markey.senate.gov/imo/media/doc/letter_on_rural_hospitals.pdf
[3] Thomas Tsai et al., “Medicaid Cuts Likely to Affect Urban Safety-Net Hospitals,” Healthcare Quality and Outcomes Lab, November 17, 2025. https://hsph.harvard.edu/health-quality/news/medicaid-cuts-likely-to-affect-urban-safety-net-hospitals/
[4] US Government Accountability Office, “Why are Urban Hospitals Closing and What Happens After They Do?,” September 24, 2025. https://www.gao.gov/blog/why-are-urban-hospitals-closing-and-what-happens-after-they-do.
[5] We used census data for ZIP codes served by the hospital and weighted it by the number of patient discharges from each ZIP code.
[6] USDA defines a high poverty area as having a poverty rate of 20.0 percent or more in a single time period, see USDA “Poverty Area Measures”: https://www.ers.usda.gov/data-products/poverty-area-measures. 85 of the 446 (19%) at-risk hospitals have a poverty rate of more than 20%.
[7] Rurality data for three of the 446 hospitals is not available. For more on rural/urban designations, see Methodology.
[8] See, e.g.,: Grace Niewijk, “Rising hospital closures disproportionately affect disadvantaged communities,” UChicago Medicine, April 26, 2024. https://biologicalsciences.uchicago.edu/news/hospital-closure-inequality ; Joseph P. Williams, “Code Red: The Grim State of Urban Hospitals,” US News & World Report, July 10, 2019. https://www.usnews.com/news/healthiest-communities/articles/2019-07-10/poor-minorities-bear-the-brunt-as-urban-hospitals-close ; US Government Accountability Office, “Why are Urban Hospitals Closing and What Happens After They Do?,” September 24, 2025. https://www.gao.gov/blog/why-are-urban-hospitals-closing-and-what-happens-after-they-do
[9] US Government Accountability Office, “Urban Hospitals: Factors Contributing to Selected Hospital Closures and Related Changes in Available Health Care Services,” GAO-25-106473. Published: Aug 20, 2025. Publicly Released: Sep 19, 2025. https://files.gao.gov/reports/GAO-25-106473/index.html?_gl=1*nc6b94*_ga*MTkyMzg2MDUwMS4xNzY3ODE3MzIw*_ga_V393SNS3SR*czE3NzAxNDc0MTgkbzIkZzEkdDE3NzAxNDc0NTIkajI2JGwwJGgw.
[10] There are 198 total hospitals in Republican congressional districts, two of which are in districts represented by Republicans who did not vote for the bill (Thomas Massie and Brian Fitzpatrick). For the Senate figure, we identified the number of hospitals in every state represented by at least one Senate Republican.
[11] “Rural Healthcare Payment and Reimbursement,” Rural Health Information Hub. https://www.ruralhealthinfo.org/topics/healthcare-payment
[12] Madeline Ashley, “California system to lay off 247,” Becker’s Hospital Review, December 26, 2025. https://www.beckershospitalreview.com/finance/california-system-to-lay-off-nearly-300/
Alameda Hospital just barely did not make it on our list, because while its average Medicaid payer mix met the criteria (51%), its average profit margin over the last 3 years narrowly avoids being in the negative (0.05). Its 2024 margin, however, dips below zero (-0.4).
[13] WGRZ Staff, “ECMC to cut 3% workforce in 2026 amid financial strains,” WGRZ, January 29, 2026. https://www.wgrz.com/article/news/health/ecmc-layoffs/71-0cfb81bf-ac8d-499d-85ca-16894a50d77d
[14] While the hospital has had a negative 3-year average margin (-0.04), its Medicaid payer mix did not meet our threshold (9.8%).
Daniel V. Ramirez, “‘Perfect storm’: Why Teton Valley Health Care chose to lay off staff, close infusion clinic,” East Idaho News, January 31, 2026. https://www.eastidahonews.com/2026/01/perfect-storm-why-teton-valley-health-care-chose-to-lay-off-staff-close-infusion-clinic/.
[15] Emily Olsen, “Trinity Health to lay off 10.5% of revenue cycle headcount,” Healthcare Dive, January 20, 2026. https://www.healthcaredive.com/news/trinity-health-layoffs-revenue-cycle-management/809980/
[16] Nada Hassanein, “US hospitals see stark decline of obstetric services, study shows,” Stateline, July 11, 2025. https://stateline.org/2025/07/11/us-hospitals-see-stark-decline-of-obstetric-services-study-shows/
[17] Note that this hospital does not appear on our list of at-risk hospitals. This is because it meets the criteria for having negative margins for 3 years, but not for having greater than Medicaid payer mix (St. Mary’s has 15% Medicaid mix).
Maya Homan, “Rural Georgia hospital plans to close its labor and delivery unit, in part due to Medicaid cuts,” Georgia Recorder, September 17, 2025. https://georgiarecorder.com/2025/09/17/rural-georgia-hospital-plans-to-close-its-labor-and-delivery-unit-in-part-due-to-medicaid-cuts/
[18] Centra press release, “Centra Southside Women’s Services Transition.” https://www.centrahealth.com/centra-southside-womens-services-transition
[19] Leslie Bonilla Muniz, “Indiana hospitals warn of cuts, closures without lawmaker intervention,” Indiana Capital Chronicle, January 28, 2026. https://indianacapitalchronicle.com/2026/01/28/indiana-hospitals-warn-of-cuts-closures-without-lawmaker-intervention/
[20] Indiana Hospital Association, “Indiana Hospitals Face Mounting Financial Pressures,” January 27, 2026. https://www.ihaconnect.org/news/indiana-hospitals-face-mounting-financial-pressures-as-medicaid-shortfalls-and-rising-costs-threaten-access-to-care?fbclid=IwY2xjawP7DrdleHRuA2FlbQIxMABicmlkETFIazJPNkVyMGFHTG9ieTdjc3J0YwZhcHBfaWQQMjIyMDM5MTc4ODIwMDg5MgABHgLN92u7JJ199DkZ34pELNDYMPT7H5ofTJ1Xa2tWqD233mEmrj4OFD3SNErI_aem_7_9jO2myhYz0-HMGgxLAmQ
[21] Press release by the Senate Committee on Finance Office of the Chairman, “The One Big Beautiful Bill Protects Rural Hospitals,” July 30, 2025. https://www.finance.senate.gov/chairmans-news/the-one-big-beautiful-bill-protects-rural-hospitals
[22] Zachary Levinson and Tricia Neuman, “A Closer Look at the $50 Billion Rural Health Fund in the New Reconciliation Law,” KFF, August 4, 2025. https://www.kff.org/medicaid/a-closer-look-at-the-50-billion-rural-health-fund-in-the-new-reconciliation-law/
[23] National Academy for State Health Policy’s (NASHP) Hospital Cost Tool (HCT). Downloaded data for 2022-2024, dataset last updated on December 30, 2025. https://tool.nashp.org/
[24] Agency for Healthcare Research and Quality’s Community-Level Health, data released September 2025 and includes data through 2023. https://www.ahrq.gov/data/innovations/clh-data.html#download; See here for Data Source Documentation. Methodology for the ZCTA to ZIP available on pg. 15. https://www.ahrq.gov/sites/default/files/wysiwyg/data/clh/CLH-Data-Sources-Documentation-2025.pdf
[25] Centers for Medicare and Medicaid Services, Hospital Service Area database. Latest data available: 2024. Accessed January 2026. https://data.cms.gov/provider-summary-by-type-of-service/medicare-inpatient-hospitals/hospital-service-area
[26] “How We Define Rural,” Health Resources & Services Administration. https://www.hrsa.gov/rural-health/about-us/what-is-rural ; Cecil G. Sheps Center for Health Services Research, List of Hospitals in the U.S., US Hospital List 2024. Accessed January 2026. https://www.shepscenter.unc.edu/programs-projects/rural-health/list-of-hospitals-in-the-u-s/.